Borrowing to pay for your education isn't appealing to everyone – especially when 30-year repayment plans are par for the course. If scholarships don't cover all or part of the bill, most schools offer university payment plans that divide tuition payments into more manageable amounts.
How University Payment Plans Works
Payment plans are programs to allow students to pay tuition in installments rather than all at once. Let's say your tuition and fees total $3,500 per semester or $7,000 for the year. You have the option of setting up an annual, semester, or monthly-based payment plan. A monthly plan would divide $7,000 among the number of months you select, based on the options provided by the institution. For example, if you select 10 monthly payments, your payments would be $700 at the beginning of each month. In some situations, your payments could start a couple of months before the fall semester starts or at enrollment. The final payment would conclude before the spring semester ends. Usually, there is no interest charged; instead, an enrollment fee of $25 to $45 is charged on each installment. Before considering university payment plans, start by getting full details on when payments are due, when (and if) interest is charged, if there are any startup charges and if there are late fees.
How Much Emergency Savings Will You Need?
Outside of college, six to eight months is considered an adequate amount of savings. One semester of expenses is the minimum needed if you are planning to get through college without borrowing money.
You can calculate expenses for one semester with a cost of attendance calculator. University websites should provide a cost of attendance calculator or generic college budgeting calculator. A good calculator will estimate total costs to attend school and should include room and board, tuition, books, fees, student health care or wellness fees and transportation. Generic college budget calculators aren't university specific and are especially helpful when you are in the planning stage of where you want to attend school. A bonus to generic college budget calculators is you can include specific expenses you are concerned about, such as spring break and other social expenses.
Once you have a number for your expenses, you need to have this amount saved before you reject any federal student loans you are eligible to receive. If you are going to rely on unguaranteed income such as tips or a job you haven't started yet, put aside an extra half-semester of cash reserves.
Use Private Loans as Last Resort
If you reject federal student loans at the beginning of the year, but experience a budget shortfall, you can still borrow private loans. However, you will forgo the fixed-interest rates.
For example, let's say you lost your job midway through the semester and could no longer afford your payments. You borrow a private loan with interest rate terms of prime plus 4%. Your interest rate and future payment schedule could rise or fall with the economy. However, you could have secured a federal student loan at the beginning of the semester that you could have paid back if you didn't have the money.
Alternative and Supplements
Choosing not to use a university payment plan doesn't mean you have to have huge student loan payments after graduation. Try these tips instead of, or in cooperation with, university payment plans.
* Base your borrowing on future income. Borrowing for education is not a bad idea if you are confident you can pay it back. You can estimate your future income by looking at entry-level positions in your field at certain job-income websites or during an appointment with your career counselor.
* Base second-year borrowing on first-year spending. Don't reject student loans if you don't have enough emergency savings to cover tuition and other expenses. You can always leave this money in an account to accumulate interest throughout your four years. If you never need it, you'll earn back the loan origination fees and then some in interest over the course of a four-year bachelor's degree.
* If you qualify for subsidized loans, you're out the loan origination fee, but the government pays your interest while you're in school. If you are unsure of how much you'll be able to pay for with a university payment plan, a good option is to exhaust subsidized student loan borrowing first.
* Reject part of your loan award. If your student-aid report comes back and says you are eligible to borrow $6,000 per semester, you don't have to borrow the full amount. Many creditors are willing to lend more than you can easily afford to repay, so be sure to borrow only as much as you need.
* Dedicate time for your scholarship search. Scholarships are always a better option than student loans or university payment plans. Whether you are attending college for the first time or you're a graduate student, make an appointment with your high school or college financial aid officer to discuss scholarships.
* If college bills are hard to handle, look for a cheaper college with similar programs. This isn't always the best option, but it's one you should consider – especially if future income doesn't match well with what you would need to borrow.
The Bottom Line
University payment plans are a terrific option for reducing student loan borrowing, but only if you can afford your payments. Tread carefully. Get full details about your university's payment plan options, calculate cost of attendance, have at least a semester in savings before you begin, and borrow federal student loans if your money is tight. You can always begin a university payment plan next year when you know you're ready.
Showing posts with label Finance. Show all posts
Showing posts with label Finance. Show all posts
Saturday, January 29, 2011

Using Base Metals As An Economic Indicator
Gold has been the stock market's darling for quite sometime now. Investors watch gold's movement with bated breath to assess the possibility of future inflation and weakness in global economies. While investors can learn a lot by watching the performance of precious metals, they should not overlook what can be learned by watching the price movements in base metals.
The performance of base metals is an excellent way to gauge economic activity around the world. While precious metals are stored up and held for investment, base metals bear watching because these are the actual inputs used in manufacturing, construction and production. Companies cannot build their products or expand their facilities without relying on these natural resources.
Types of Base Metals
So, what is a base metal anyway? Base metals are common metals that can typically be found in plentiful supply. Copper, zinc, aluminum, steel, tin and lead are examples of some of the more popular types of base metals. Since base metals are more readily available, they often do not have the hefty prices of precious metals. For example, while gold traded at a whopping $1,400 an ounce in 2010, copper traded for just $4 a pound. That's a pretty drastic difference!
The base metals have a variety of applications in almost every industry. Steel is used for building houses, automobiles, plants, factories and equipment. Copper is used for just about anything including wires, pipes, construction projects, heating and cooling systems. Zinc is used to produce batteries, fuel cells, die castings and making brass. Aluminum is useful in creating planes, cans, utensils, brakes and transmission lines. Tin is used to coat a number of products, including cans, containers and packages. Lead is used in construction projects and batteries. These are just a few of the uses for these well-known base metals - there are thousands more. (For more, check out The Copper King: An Empire Built On Manipulation.)
Base Metals and Price Movement
Metal prices are largely controlled by consumer demand for the products that they are inputs for. Take the price of steel as an example. Hot-rolled coiled steel peaked before the financial crisis of 2008, reaching its apex in 2004 when global economies were booming. New buildings, cars and many other products were driving up the price up until 2004, and then demand leveled off or began to decline slowly. Steel fell off of a cliff in early 2009, as demand for the products and the metal itself waned. Iron ore, copper and aluminum took similar plunges in the face of dropping production and, therefore, dropping demand. The flat-lined or declining steel prices from 2004 to 2009, when prices plummeted, can now be interpreted as an early sign of economic problems to come.
Not everyone was selling out at the low, however. China went on a metals buying spree in 2009 and 2010, and the metals market surged once again. China stockpiled steel, iron ore and copper while prices were low because they knew that a base-metals rebound was coming. The country's government predicted the trend correctly and base metals recovered nicely. The steel industry saw hot-rolled coil prices surge to $700 during the global recovery of early 2010. Prices pulled back somewhat during the summer of 2010 as stimulus packages stopped – slowing government funded construction projects - and global economies also slowed down. The lead time on base metal prices as an indicator can be short, but there is a pattern that has held up in modern times.
Base Metals and Global Economies
Investors who want to know where global economies are headed should keep an eye on base metals. Base metals are a great precursor for signaling economic growth. They are used by many professional traders as a leading economic indicator. Famed trader Dennis Gartman has been known to watch copper, steel and aluminum indexes to judge the appetite of consumers around the world. Gartman stated that many base metals "moved downwards long before the data signaled weakness in the global economy."
Base Metals and Demand
The demand for base metals during times of economic uncertainty can tell you a lot about the economy as a whole. High demand during tough economic times shows that both business and consumer confidence remains high. Low demand leads to falling prices and is a sign of fear in the marketplace. Investor appetite for these hard metals decreases during economic slowdowns, just as it does for producers. However, this decline has a limit, as dwindling supplies and/or shortage fears, however temporary, help to buoy the prices of base metals as stockpiling drives up demand.
Base metal production and demand nearly have a perfectly symmetrical relationship. As demand for base metals increases, metal producers ratchet up production. Consequently, the flood of supply on the open market eventually leads to a decline in metals prices as supply outpaces demand. Metals prices reach their highest point when three factors align to distort the balance between supply and demand. This is when the supplies of metals are tight, demand is strong and production is already at or near full capacity.
Other Factors
As with any other asset, base metal prices can also rise and fall on speculation by investors and traders. For example, the mere hint that a major investor like Jim Rogers is buying metals can move the whole market on a given day. Moreover, reports about the Federal Reserve easing monetary policy often drives up metal prices, as the issuance of more governmental debt strengthens the demand for precious and base metals because of their perceived hedge against inflation. Currency moves also affect the metals market. A weak dollar or Japanese yen can send investors running for the safety of hard assets just like inflation fears do. As a result, using base metal prices as an economic indicator requires that an investor look at who is driving the demand. Is it the producers using the metals to make more products or is it investors looking to escape inflation or weak currencies?
Bottom Line
As you can clearly see, base metals are a major factor in driving economic growth, but their message to investors can be hard to read. These metals are used for building homes, automobiles, plants, equipment, pipes, wires and just about any other product that you can find. If you want to know which way the economy is moving, looking at the trend in base metal prices is a good place to start.
The performance of base metals is an excellent way to gauge economic activity around the world. While precious metals are stored up and held for investment, base metals bear watching because these are the actual inputs used in manufacturing, construction and production. Companies cannot build their products or expand their facilities without relying on these natural resources.
Types of Base Metals
So, what is a base metal anyway? Base metals are common metals that can typically be found in plentiful supply. Copper, zinc, aluminum, steel, tin and lead are examples of some of the more popular types of base metals. Since base metals are more readily available, they often do not have the hefty prices of precious metals. For example, while gold traded at a whopping $1,400 an ounce in 2010, copper traded for just $4 a pound. That's a pretty drastic difference!
The base metals have a variety of applications in almost every industry. Steel is used for building houses, automobiles, plants, factories and equipment. Copper is used for just about anything including wires, pipes, construction projects, heating and cooling systems. Zinc is used to produce batteries, fuel cells, die castings and making brass. Aluminum is useful in creating planes, cans, utensils, brakes and transmission lines. Tin is used to coat a number of products, including cans, containers and packages. Lead is used in construction projects and batteries. These are just a few of the uses for these well-known base metals - there are thousands more. (For more, check out The Copper King: An Empire Built On Manipulation.)
Base Metals and Price Movement
Metal prices are largely controlled by consumer demand for the products that they are inputs for. Take the price of steel as an example. Hot-rolled coiled steel peaked before the financial crisis of 2008, reaching its apex in 2004 when global economies were booming. New buildings, cars and many other products were driving up the price up until 2004, and then demand leveled off or began to decline slowly. Steel fell off of a cliff in early 2009, as demand for the products and the metal itself waned. Iron ore, copper and aluminum took similar plunges in the face of dropping production and, therefore, dropping demand. The flat-lined or declining steel prices from 2004 to 2009, when prices plummeted, can now be interpreted as an early sign of economic problems to come.
Not everyone was selling out at the low, however. China went on a metals buying spree in 2009 and 2010, and the metals market surged once again. China stockpiled steel, iron ore and copper while prices were low because they knew that a base-metals rebound was coming. The country's government predicted the trend correctly and base metals recovered nicely. The steel industry saw hot-rolled coil prices surge to $700 during the global recovery of early 2010. Prices pulled back somewhat during the summer of 2010 as stimulus packages stopped – slowing government funded construction projects - and global economies also slowed down. The lead time on base metal prices as an indicator can be short, but there is a pattern that has held up in modern times.
Base Metals and Global Economies
Investors who want to know where global economies are headed should keep an eye on base metals. Base metals are a great precursor for signaling economic growth. They are used by many professional traders as a leading economic indicator. Famed trader Dennis Gartman has been known to watch copper, steel and aluminum indexes to judge the appetite of consumers around the world. Gartman stated that many base metals "moved downwards long before the data signaled weakness in the global economy."
Base Metals and Demand
The demand for base metals during times of economic uncertainty can tell you a lot about the economy as a whole. High demand during tough economic times shows that both business and consumer confidence remains high. Low demand leads to falling prices and is a sign of fear in the marketplace. Investor appetite for these hard metals decreases during economic slowdowns, just as it does for producers. However, this decline has a limit, as dwindling supplies and/or shortage fears, however temporary, help to buoy the prices of base metals as stockpiling drives up demand.
Base metal production and demand nearly have a perfectly symmetrical relationship. As demand for base metals increases, metal producers ratchet up production. Consequently, the flood of supply on the open market eventually leads to a decline in metals prices as supply outpaces demand. Metals prices reach their highest point when three factors align to distort the balance between supply and demand. This is when the supplies of metals are tight, demand is strong and production is already at or near full capacity.
Other Factors
As with any other asset, base metal prices can also rise and fall on speculation by investors and traders. For example, the mere hint that a major investor like Jim Rogers is buying metals can move the whole market on a given day. Moreover, reports about the Federal Reserve easing monetary policy often drives up metal prices, as the issuance of more governmental debt strengthens the demand for precious and base metals because of their perceived hedge against inflation. Currency moves also affect the metals market. A weak dollar or Japanese yen can send investors running for the safety of hard assets just like inflation fears do. As a result, using base metal prices as an economic indicator requires that an investor look at who is driving the demand. Is it the producers using the metals to make more products or is it investors looking to escape inflation or weak currencies?
Bottom Line
As you can clearly see, base metals are a major factor in driving economic growth, but their message to investors can be hard to read. These metals are used for building homes, automobiles, plants, equipment, pipes, wires and just about any other product that you can find. If you want to know which way the economy is moving, looking at the trend in base metal prices is a good place to start.
Tuesday, January 25, 2011
Microfinance: What It Is And How To Get Involved
What is microfinance?
The term "microfinance" describes the range of financial products (such as microloans, microsavings and micro-insurance products) that microfinance institutions (MFIs) offer to their clients. Microfinance began in the 1970s when social entrepreneurs began lending money on a large scale to the working poor. One individual who gained worldwide recognition for his work in microfinance is professor Muhammad Yunus who, with Grameen Bank, won the 2006 Nobel Peace Prize. Yunas and Grameen Bank demonstrated that the poor have the ability to pull themselves out of poverty. Yunus also demonstrated that loans made to the working poor, if properly structured, had very high repayment rates. His work caught the attention of both social engineers and profit-seeking investors.
Historically, the goal of microfinance was the alleviation of poverty. For many years, microfinance had this primary social objective and so traditional MFIs consisted only of non-governmental organizations (NGO), specialized microfinance banks and public sector banks. More recently, the marketplace has been evolving. For example, some non-profit MFIs are transforming themselves into profit-seeking institutions to achieve greater strength, sustainability and market reach. They are being joined in the microfinance marketplace by consumer finance companies, like GE Finance and Citi Finance. "Big-box" consumer retailers, like Wal-Mart, Elektra and Tesco are beginning to emerge as consumer lenders and a few are venturing into microfinance. Although most MFIs still consider poverty alleviation the primary goal, selling more products to more consumers is the primary motivation of many new entrants.
Microfinance Products and Services
The following products and services are currently being offered by MFIs:
* Microloans: Microloans (also known as microcredit) are loans that have a small value; most loans are less than $100 in size. These loans are generally issued to finance entrepreneurs who run micro-enterprises in developing countries. Examples of micro-enterprises include basket-making, sewing, street vending and raising poultry. The average global interest rate charged on micro-loans is about 35%. Although this may sound high, it is much lower than other available alternatives (such as informal local money lenders). Moreover, MFIs must charge interest rates that cover the higher costs associated with processing the labor-intensive micro-loan transactions.
* Microsavings: Microsavings accounts allow individuals to store small amounts of money for future use without minimum balance requirements. Like traditional savings accounts in developed nations, micro-savings accounts are tapped by the saver for life needs such as weddings, funerals and old-age supplementary income.
* Micro-Insurance: Individuals living in developing nations have more risks and uncertainties in their lives. For example, there is more direct exposure to natural disasters, such as mudslides, and more health-related risks, such as communicable diseases. Micro-insurance, like its non-micro counterpart, pools risks and helps provide risk management. But unlike its traditional counterpart, micro-insurance allows for insurance policies that have very small premiums and policy amounts. Examples of micro-insurance policies include crop insurance and policies that cover outstanding balances of micro-loans in the event a borrower dies. Due to the high administrative expense ratios, micro-insurance is most efficient for MFIs when premiums are collected together with microloan repayments.
What does microfinance mean for you?
The development and growth of the microfinance market affects more than just those who are engaging in or contemplating microfinance services. Here's how it may affect you:
* As an investor: Return-focused institutional investors are now making microfinance-related investments. In addition, major ratings agencies are rating microfinance transactions. For example, Morgan Stanley issued a microfinance backed bond, which contained tranches and was rated "AA" by S&P.
This shows that microfinance is beginning to provide investment opportunities for all investors. The Micro Banking Bulletin reports that 63 of the world's top MFIs have an average return (after adjusting for inflation and after taking out subsidies programs received) of about 2.5% of total assets. Local and regional banks are generally the first to integrate microfinance investments into their portfolios, while large international banks currently prefer to provide financing to other banks, MFIs or NGOs. As mentioned earlier, even consumer finance companies may have exposure to microfinance activities. As an investor, you may wish to look to see whether the companies you are investing in have exposure to microfinance and if so, whether the risk-return characteristics of those activities appeal to you. Visit the MIX market for current information on the supply, demand and facilitation of capital within the microfinance market.
* As a finance professional: Microfinance requires highly specialized financial knowledge as well as a unique combination of skills, such as knowledge of social science, local languages and customs. New careers are emerging to fit these unique demands. For finance professionals, this means that new careers are opening up for those who have this unique combinations of skills and experiences. Moreover, traditional career roles are blurring as microfinance brings together professionals with varied backgrounds to work in collaborative teams. For example, development professionals (such as people who have worked for the Asian Development Bank or other development agencies) can now be found working side by side with venture capitalists. A wide range of microfinance career opportunities can be found at Microfinance Gateway.
* As an individual: Some believe that we are living in a time when poverty may be eradicated. Studies support that belief. According to the Virtual Library on Microcredit, during an eight-year period, among the poorest in Bangladesh with no credit service of any type, only 4% pulled themselves above the poverty line. But with individuals and families with microcredit from an MFI, more than 48% rose above the poverty line. What poverty eradication means to you as an individual depends largely upon your personal philosophy. You might welcome it as a key achievement in the history of humanity. You also might celebrate the possibility that we each can all buy and sell to one another. Individuals who seek to be a part of this poverty eradication phenomenon may now loan money to a micro-entrepreneur in another part of the world through the non-profit online service Kiva.
The term "microfinance" describes the range of financial products (such as microloans, microsavings and micro-insurance products) that microfinance institutions (MFIs) offer to their clients. Microfinance began in the 1970s when social entrepreneurs began lending money on a large scale to the working poor. One individual who gained worldwide recognition for his work in microfinance is professor Muhammad Yunus who, with Grameen Bank, won the 2006 Nobel Peace Prize. Yunas and Grameen Bank demonstrated that the poor have the ability to pull themselves out of poverty. Yunus also demonstrated that loans made to the working poor, if properly structured, had very high repayment rates. His work caught the attention of both social engineers and profit-seeking investors.
Historically, the goal of microfinance was the alleviation of poverty. For many years, microfinance had this primary social objective and so traditional MFIs consisted only of non-governmental organizations (NGO), specialized microfinance banks and public sector banks. More recently, the marketplace has been evolving. For example, some non-profit MFIs are transforming themselves into profit-seeking institutions to achieve greater strength, sustainability and market reach. They are being joined in the microfinance marketplace by consumer finance companies, like GE Finance and Citi Finance. "Big-box" consumer retailers, like Wal-Mart, Elektra and Tesco are beginning to emerge as consumer lenders and a few are venturing into microfinance. Although most MFIs still consider poverty alleviation the primary goal, selling more products to more consumers is the primary motivation of many new entrants.
Microfinance Products and Services
The following products and services are currently being offered by MFIs:
* Microloans: Microloans (also known as microcredit) are loans that have a small value; most loans are less than $100 in size. These loans are generally issued to finance entrepreneurs who run micro-enterprises in developing countries. Examples of micro-enterprises include basket-making, sewing, street vending and raising poultry. The average global interest rate charged on micro-loans is about 35%. Although this may sound high, it is much lower than other available alternatives (such as informal local money lenders). Moreover, MFIs must charge interest rates that cover the higher costs associated with processing the labor-intensive micro-loan transactions.
* Microsavings: Microsavings accounts allow individuals to store small amounts of money for future use without minimum balance requirements. Like traditional savings accounts in developed nations, micro-savings accounts are tapped by the saver for life needs such as weddings, funerals and old-age supplementary income.
* Micro-Insurance: Individuals living in developing nations have more risks and uncertainties in their lives. For example, there is more direct exposure to natural disasters, such as mudslides, and more health-related risks, such as communicable diseases. Micro-insurance, like its non-micro counterpart, pools risks and helps provide risk management. But unlike its traditional counterpart, micro-insurance allows for insurance policies that have very small premiums and policy amounts. Examples of micro-insurance policies include crop insurance and policies that cover outstanding balances of micro-loans in the event a borrower dies. Due to the high administrative expense ratios, micro-insurance is most efficient for MFIs when premiums are collected together with microloan repayments.
What does microfinance mean for you?
The development and growth of the microfinance market affects more than just those who are engaging in or contemplating microfinance services. Here's how it may affect you:
* As an investor: Return-focused institutional investors are now making microfinance-related investments. In addition, major ratings agencies are rating microfinance transactions. For example, Morgan Stanley issued a microfinance backed bond, which contained tranches and was rated "AA" by S&P.
This shows that microfinance is beginning to provide investment opportunities for all investors. The Micro Banking Bulletin reports that 63 of the world's top MFIs have an average return (after adjusting for inflation and after taking out subsidies programs received) of about 2.5% of total assets. Local and regional banks are generally the first to integrate microfinance investments into their portfolios, while large international banks currently prefer to provide financing to other banks, MFIs or NGOs. As mentioned earlier, even consumer finance companies may have exposure to microfinance activities. As an investor, you may wish to look to see whether the companies you are investing in have exposure to microfinance and if so, whether the risk-return characteristics of those activities appeal to you. Visit the MIX market for current information on the supply, demand and facilitation of capital within the microfinance market.
* As a finance professional: Microfinance requires highly specialized financial knowledge as well as a unique combination of skills, such as knowledge of social science, local languages and customs. New careers are emerging to fit these unique demands. For finance professionals, this means that new careers are opening up for those who have this unique combinations of skills and experiences. Moreover, traditional career roles are blurring as microfinance brings together professionals with varied backgrounds to work in collaborative teams. For example, development professionals (such as people who have worked for the Asian Development Bank or other development agencies) can now be found working side by side with venture capitalists. A wide range of microfinance career opportunities can be found at Microfinance Gateway.
* As an individual: Some believe that we are living in a time when poverty may be eradicated. Studies support that belief. According to the Virtual Library on Microcredit, during an eight-year period, among the poorest in Bangladesh with no credit service of any type, only 4% pulled themselves above the poverty line. But with individuals and families with microcredit from an MFI, more than 48% rose above the poverty line. What poverty eradication means to you as an individual depends largely upon your personal philosophy. You might welcome it as a key achievement in the history of humanity. You also might celebrate the possibility that we each can all buy and sell to one another. Individuals who seek to be a part of this poverty eradication phenomenon may now loan money to a micro-entrepreneur in another part of the world through the non-profit online service Kiva.
Saturday, October 2, 2010
Investment Scams: Bulletin Boards and Newsletters
Investment Scams: Bulletin Boards
There are literally hundreds of investment boards where anyone can rant, rave, or post BS. Online bulletin boards (BBs) come in various forms, including newsgroups, usenet, or web-based boards. Some of the larger BBs, like those found on sites such as Raging Bull, Boards on Yahoo! Finance, and Silicon Investor, see thousands of messages posted on an hourly basis.
While there are many valid and useful posts on these boards, a large number of tips turn out to be bogus. Fraudsters most often use a pump and dump scheme on BBs by pretending to reveal inside information about big upcoming announcements, great new products, or lucrative contracts. The opposite can be done too. If fraudsters hold a short position in a company, they will try to spread negative rumors in the hope that investors will panic and push prices down.
Here's the tricky part about BBs: anonymity. You don't know for sure who you're dealing with and how credible they are. People claiming to be unbiased observers who've carefully researched a company may actually be company insiders, large shareholders, or paid promoters. A single person can easily create the illusion of widespread interest in a small, thinly-traded stock by posting a series of messages under various aliases.
In the aftermath of the dotcom bubble, bulletin boards experienced a dramatic drop in traffic. Thankfully, many investors realized they couldn't believe everything they read online. But that's not to say there is no valuable information on BBs. Before Enron went bankrupt, posts were made online that revealed many of the fraudulent practices taking place at the energy giant. Regrettably, at the same time, there were countless posts that were bullish on Enron. It's nearly impossible to sort out the valuable posts from the fake ones.
Investment Scams: Newsletters
Almost every stock pick site offers a newsletter that is supposedly full of useful insights and great stocks. There are many good newsletters out there, but some are just promoting stocks under the guise of presenting investors with "free unbiased information."
In fact, many companies hire employees or pay people to write online newsletters to promote their stock. In theory, this practice is not illegal. But federal securities laws require newsletters to disclose who paid them, the amount paid, and the type of payment. Most fraudulent newsletters fail to provide this information. Instead, they lie about the income they receive, their independence, their research, and their historical results. They stand to profit handsomely if they convince investors to buy or sell particular stocks. Newsletters also use the pump and dump technique discussed earlier. With enough people on the list, it is possible to create movement in the price of small stocks.
Even worse is junk e-mail or "spam." As spam costs next to nothing to create, it has become the tool of choice for many fraudsters. Often these messages consist of “get-rich-quick” schemes and offer "guaranteed results." If the sender is unfamiliar to you or the message is addressed generally (great investment tip) it is likely a scam. Brokers and traders don't give away good tips to random people for free. Besides, no reputable company would spam to get their name out. The smartest thing you can do is hit your delete button.
Identifying these shady e-mails isn't tough. Besides promising huge results with no risk, look for CAPITALIZED LETTERS WITH MANY EXCLAMATION MARKS!!! FOR SOME REASON SCAM ARTISTS THINK YOU'LL LISTEN IF THEY WRITE LIKE THEY ARE SCREAMING AT YOU!!! Another clue is when the e-mail comes from free e-mail providers such as yahoo.com or hotmail.com. Spammers use these addresses to hide where the original message comes from.
There are literally hundreds of investment boards where anyone can rant, rave, or post BS. Online bulletin boards (BBs) come in various forms, including newsgroups, usenet, or web-based boards. Some of the larger BBs, like those found on sites such as Raging Bull, Boards on Yahoo! Finance, and Silicon Investor, see thousands of messages posted on an hourly basis.
While there are many valid and useful posts on these boards, a large number of tips turn out to be bogus. Fraudsters most often use a pump and dump scheme on BBs by pretending to reveal inside information about big upcoming announcements, great new products, or lucrative contracts. The opposite can be done too. If fraudsters hold a short position in a company, they will try to spread negative rumors in the hope that investors will panic and push prices down.
Here's the tricky part about BBs: anonymity. You don't know for sure who you're dealing with and how credible they are. People claiming to be unbiased observers who've carefully researched a company may actually be company insiders, large shareholders, or paid promoters. A single person can easily create the illusion of widespread interest in a small, thinly-traded stock by posting a series of messages under various aliases.
In the aftermath of the dotcom bubble, bulletin boards experienced a dramatic drop in traffic. Thankfully, many investors realized they couldn't believe everything they read online. But that's not to say there is no valuable information on BBs. Before Enron went bankrupt, posts were made online that revealed many of the fraudulent practices taking place at the energy giant. Regrettably, at the same time, there were countless posts that were bullish on Enron. It's nearly impossible to sort out the valuable posts from the fake ones.
Investment Scams: Newsletters
Almost every stock pick site offers a newsletter that is supposedly full of useful insights and great stocks. There are many good newsletters out there, but some are just promoting stocks under the guise of presenting investors with "free unbiased information."
In fact, many companies hire employees or pay people to write online newsletters to promote their stock. In theory, this practice is not illegal. But federal securities laws require newsletters to disclose who paid them, the amount paid, and the type of payment. Most fraudulent newsletters fail to provide this information. Instead, they lie about the income they receive, their independence, their research, and their historical results. They stand to profit handsomely if they convince investors to buy or sell particular stocks. Newsletters also use the pump and dump technique discussed earlier. With enough people on the list, it is possible to create movement in the price of small stocks.
Even worse is junk e-mail or "spam." As spam costs next to nothing to create, it has become the tool of choice for many fraudsters. Often these messages consist of “get-rich-quick” schemes and offer "guaranteed results." If the sender is unfamiliar to you or the message is addressed generally (great investment tip) it is likely a scam. Brokers and traders don't give away good tips to random people for free. Besides, no reputable company would spam to get their name out. The smartest thing you can do is hit your delete button.
Identifying these shady e-mails isn't tough. Besides promising huge results with no risk, look for CAPITALIZED LETTERS WITH MANY EXCLAMATION MARKS!!! FOR SOME REASON SCAM ARTISTS THINK YOU'LL LISTEN IF THEY WRITE LIKE THEY ARE SCREAMING AT YOU!!! Another clue is when the e-mail comes from free e-mail providers such as yahoo.com or hotmail.com. Spammers use these addresses to hide where the original message comes from.
Friday, October 1, 2010
Investment Scams: Different Types Of Scams
Very few of the scams on the Internet are new. Most of the swindling techniques we see today originated long ago as telemarketing, direct mail, or even door-to-door selling schemes. But the Internet adds another troubling dimension to these old tricks. For example, a fancy Web site can create the illusion of a large and reputable company, especially if it provides links to legitimate sites.
Here are some of the largest and most successful investment scams:
* Ponzi Scheme - A type of pyramid scheme, this is where money from new investors is used to provide a return to previous investors. The scheme collapses when money owed to previous investors is greater than the money that can be raised from new ones. Ponzi schemes always collapse eventually.
* Pump and Dump - A highly illegal practice where a small group of informed people buy a stock before they recommend it to thousands of investors. The result is a quick spike in stock price followed by an equally fast downfall. The perpetrators who bought the stock early sell off when the price peaks at a huge profit. Most pump and dump schemes recommend companies that are over-the-counter bulletin board (OTCBB) and have a small float. Small companies are more volatile and it's easier to manipulate a stock when there's little or no information available about the company. There is also a variation of this scam called the "short and distort." Instead of spreading positive news, fraudsters use a smear campaign and attempt to drive the stock price down. Profit is then made by short selling.
* Off Shore Investing - These are becoming one of the more popular scams to trap U.S. and Canadian investors. Conflicting time zones, differing currencies, and the high costs of international telephone calls made it difficult for fraudsters to prey on North American residents. The Internet has eroded these barriers. Be all the more cautious when considering an investment opportunity originating in another country. It's extremely difficult for your local law enforcement agencies to investigate and prosecute foreign criminals.
* Prime Bank - This term usually describes the top 50 banks (or thereabouts) in the world. Prime banks trade high quality and low risk instruments such as world paper, International Monetary Fund bonds, and Federal Reserve notes. You should be very wary when you hear this term--it is often used by fraudsters looking to lend legitimacy to their cause. Prime bank programs often claim investors' funds will be used to purchase and trade "prime bank" financial instruments for huge gains. Unfortunately these "prime bank" instruments often never exist and people lose all of their money.
Here are some of the largest and most successful investment scams:
* Ponzi Scheme - A type of pyramid scheme, this is where money from new investors is used to provide a return to previous investors. The scheme collapses when money owed to previous investors is greater than the money that can be raised from new ones. Ponzi schemes always collapse eventually.
* Pump and Dump - A highly illegal practice where a small group of informed people buy a stock before they recommend it to thousands of investors. The result is a quick spike in stock price followed by an equally fast downfall. The perpetrators who bought the stock early sell off when the price peaks at a huge profit. Most pump and dump schemes recommend companies that are over-the-counter bulletin board (OTCBB) and have a small float. Small companies are more volatile and it's easier to manipulate a stock when there's little or no information available about the company. There is also a variation of this scam called the "short and distort." Instead of spreading positive news, fraudsters use a smear campaign and attempt to drive the stock price down. Profit is then made by short selling.
* Off Shore Investing - These are becoming one of the more popular scams to trap U.S. and Canadian investors. Conflicting time zones, differing currencies, and the high costs of international telephone calls made it difficult for fraudsters to prey on North American residents. The Internet has eroded these barriers. Be all the more cautious when considering an investment opportunity originating in another country. It's extremely difficult for your local law enforcement agencies to investigate and prosecute foreign criminals.
* Prime Bank - This term usually describes the top 50 banks (or thereabouts) in the world. Prime banks trade high quality and low risk instruments such as world paper, International Monetary Fund bonds, and Federal Reserve notes. You should be very wary when you hear this term--it is often used by fraudsters looking to lend legitimacy to their cause. Prime bank programs often claim investors' funds will be used to purchase and trade "prime bank" financial instruments for huge gains. Unfortunately these "prime bank" instruments often never exist and people lose all of their money.
Thursday, September 30, 2010
Debit card fraud occurs when a criminal gains access to your debit card number and, in some cases, PIN, to make unauthorized purchases and/or withdraw cash from your account. There are many different methods of obtaining your information, from unscrupulous employees to hackers gaining access your data from a retailer's unsecure computer.
When your debit card is used fraudulently, the money is missing from your account instantly. Payments you've scheduled or checks you've mailed may bounce; you may not be able to afford necessities, and it can take awhile for the fraud to be cleared up and the money restored to your account.
How to Detect Debit Card Fraud
Fortunately, it doesn't take any special skills to detect debit card fraud. The easiest way to spot problems early is to sign up for online banking, if you haven't already. Check your balance and recent transactions daily. The sooner you detect fraud, the easier it will be to limit its impact on your finances and your life. If you see unfamiliar transactions, call the bank right away. If you're the forgetful type, start hanging on to the receipts from your debit card transactions so you can compare these against your online transactions.
If you don't want to bank online, you can keep tabs on your recent transactions via phone banking. In the very least, you should review your monthly bank statement as soon as you receive them, and check your account balance whenever you visit an ATM or bank teller. However, it can take much longer to detect fraud using these methods.
9 Easy Ways to Protect Yourself
While you may not have any control over hackers and other thieves, there are many things you can control that will help you avoid becoming a victim.
* Get banking alerts. In addition to checking your balance and recent transactions online daily, you can sign up for banking alerts. Your bank will then contact you by email or text message when certain activity occurs on your account, such as a withdrawal exceeding an amount you specify or a change of address.
* Go paperless. Signing up for paperless bank statements will eliminate the possibility of having bank account information stolen from your mailbox. Shredding existing bank statements and debit card receipts using a diamond-cut shredder when you're done with them will greatly reduce the possibility of having bank account information stolen from your trash.
* Don't make purchases with your debit card. Use a credit card instead, because it offers greater protection against fraud. If you do make debit card purchases, don't use your PIN - tell the cashier to select the credit option. The money for your purchase will still be withdrawn from your account right away, but you won't expose yourself to PIN theft. (If you want to make the switch to credit cards, read 6 Major Credit Card Mistakes to learn how to use these tools wisely.)
* Stick to bank ATMs. They tend to have better security (video cameras) than ATMs at convenience stores, restaurants and other places.
* Destroy old debit cards. Some shredders will take care of this for you.
* Don't keep all your money in one place. If your checking account is compromised, you want to be able to access cash from another source to pay for necessities and meet your financial obligations. (For more, see 5 ATM Scams That Can Break The Bank.)
* Beware of phishing scams. When checking your email or doing business online, make sure you know who you're interacting with. (See What Is A Phishing Scam And How Can They Be Avoided?)
* Protect your computer. Use firewall, anti-virus and anti-spyware software on your computer, and keep it updated regularly.
* Use a secured network. Don't do financial transactions online, when using your computer in a public place and/or over an unsecured network.
What to Do if it Happens to You
If you learn that your debit card information has been compromised, contact your bank immediately to limit the damage the thief can do, and limit your financial responsibility for the fraud. Make contact immediately by phone, and follow up with a detailed letter stating the full name of the bank employee you spoke with, details of the fraudulent transactions, and any ideas you have about how your account may have been compromised. Ask your bank to waive any NSF fees that may be incurred because of the fraud, and to restore the fraudulently withdrawn funds to your account.
Hopefully, you won't have any trouble resolving the issue directly with your bank, but if you do, you can contact a legitimate consumer advocacy group such as Privacy Rights Clearinghouse. There are also government organizations to contact if your bank isn't cooperating. The agency to contact depends on the type of bank you use.
If you're not sure which one to call, start with the OCC. (If you're not getting along with your bank, don't be afraid to switch.)
If you will have trouble making any of your monthly payments because of the fraud, contact those creditors, explain the situation and ask if they can do anything for you. This step is extremely important, as failure to do so implies your unwillingness to pay them. However, if they know about your hardship, they may be willing to work with you to reschedule payments.
Conclusion
Anything you can do to make a thief's work more difficult, whether it's staying on top of your balance, spreading your cash out across multiple accounts or making purchases with credit cards instead of debit, will help safeguard your checking account and decrease your chances of becoming a victim of debit card fraud.
When your debit card is used fraudulently, the money is missing from your account instantly. Payments you've scheduled or checks you've mailed may bounce; you may not be able to afford necessities, and it can take awhile for the fraud to be cleared up and the money restored to your account.
How to Detect Debit Card Fraud
Fortunately, it doesn't take any special skills to detect debit card fraud. The easiest way to spot problems early is to sign up for online banking, if you haven't already. Check your balance and recent transactions daily. The sooner you detect fraud, the easier it will be to limit its impact on your finances and your life. If you see unfamiliar transactions, call the bank right away. If you're the forgetful type, start hanging on to the receipts from your debit card transactions so you can compare these against your online transactions.
If you don't want to bank online, you can keep tabs on your recent transactions via phone banking. In the very least, you should review your monthly bank statement as soon as you receive them, and check your account balance whenever you visit an ATM or bank teller. However, it can take much longer to detect fraud using these methods.
9 Easy Ways to Protect Yourself
While you may not have any control over hackers and other thieves, there are many things you can control that will help you avoid becoming a victim.
* Get banking alerts. In addition to checking your balance and recent transactions online daily, you can sign up for banking alerts. Your bank will then contact you by email or text message when certain activity occurs on your account, such as a withdrawal exceeding an amount you specify or a change of address.
* Go paperless. Signing up for paperless bank statements will eliminate the possibility of having bank account information stolen from your mailbox. Shredding existing bank statements and debit card receipts using a diamond-cut shredder when you're done with them will greatly reduce the possibility of having bank account information stolen from your trash.
* Don't make purchases with your debit card. Use a credit card instead, because it offers greater protection against fraud. If you do make debit card purchases, don't use your PIN - tell the cashier to select the credit option. The money for your purchase will still be withdrawn from your account right away, but you won't expose yourself to PIN theft. (If you want to make the switch to credit cards, read 6 Major Credit Card Mistakes to learn how to use these tools wisely.)
* Stick to bank ATMs. They tend to have better security (video cameras) than ATMs at convenience stores, restaurants and other places.
* Destroy old debit cards. Some shredders will take care of this for you.
* Don't keep all your money in one place. If your checking account is compromised, you want to be able to access cash from another source to pay for necessities and meet your financial obligations. (For more, see 5 ATM Scams That Can Break The Bank.)
* Beware of phishing scams. When checking your email or doing business online, make sure you know who you're interacting with. (See What Is A Phishing Scam And How Can They Be Avoided?)
* Protect your computer. Use firewall, anti-virus and anti-spyware software on your computer, and keep it updated regularly.
* Use a secured network. Don't do financial transactions online, when using your computer in a public place and/or over an unsecured network.
What to Do if it Happens to You
If you learn that your debit card information has been compromised, contact your bank immediately to limit the damage the thief can do, and limit your financial responsibility for the fraud. Make contact immediately by phone, and follow up with a detailed letter stating the full name of the bank employee you spoke with, details of the fraudulent transactions, and any ideas you have about how your account may have been compromised. Ask your bank to waive any NSF fees that may be incurred because of the fraud, and to restore the fraudulently withdrawn funds to your account.
Hopefully, you won't have any trouble resolving the issue directly with your bank, but if you do, you can contact a legitimate consumer advocacy group such as Privacy Rights Clearinghouse. There are also government organizations to contact if your bank isn't cooperating. The agency to contact depends on the type of bank you use.
If you're not sure which one to call, start with the OCC. (If you're not getting along with your bank, don't be afraid to switch.)
If you will have trouble making any of your monthly payments because of the fraud, contact those creditors, explain the situation and ask if they can do anything for you. This step is extremely important, as failure to do so implies your unwillingness to pay them. However, if they know about your hardship, they may be willing to work with you to reschedule payments.
Conclusion
Anything you can do to make a thief's work more difficult, whether it's staying on top of your balance, spreading your cash out across multiple accounts or making purchases with credit cards instead of debit, will help safeguard your checking account and decrease your chances of becoming a victim of debit card fraud.
Sunday, September 26, 2010
How To Avoid Emotional Investing
Investors have a knack for piling into investments at the top and selling at the bottom. Many investors get caught up in media hype or fear and buy or sell investments at the peaks and valleys of the cycle. Why does this type of emotional investing happen and how can investors avoid both the euphoric and depressive investment traps? Read on for some tips on how to keep an even keel - and keep your investments on track.
Investor Behavior
The behavior of investors has been well documented; there are numerous theories that attempt to explain the regret and overreaction that buyers and sellers experience when it comes to money and the potential gains and losses on that money. Investors' psyche overpowers rational thinking during times of stress, whether that stress is a result of euphoria or fear.
The typical non-professional investor is putting his hard-earned cash at stake and, while hoping for a gain, wants to protect that cash against losses. Investors get investment "information" from many sources, such as mainstream media, financial news, friends, family and co-workers. Oftentimes investors get enticed by the market during periods of market calm (low volatility) and prolonged bull markets.
Bull markets are periods when the market tends to go up indiscriminately. During such times of market exuberance, investors tend to listen to stories from friends or family members about how much money they are making in the market, creating a stir and compelling those not invested to test the waters. Likewise, when investors read stories about a bad economy or hear reports about a volatile or negative market period, fear takes over and they sell at the bottom. (Not all investors are mentally prepared for when a much-awaited bull market finally comes charging in.
Bad Timing
The lag between when an event occurs and when it is reported is what typically causes investors to lose money. The media will report a bull market only once it has already hit; unless the trend continues, stocks will retract in upcoming periods. Investors, influenced by the reports, often choose these times of premium valuations to build up their portfolios. It is worrisome when the daily stock market report leads off the mainstream news because it creates a buzz and investors make decisions based on "opinions" that are often outdated. Market uncertainty creates fear and brings about an atmosphere of emotional investing.
Time Tested Theory
The theory that many market participants buy at the top and sell at the bottom has proved to be true based on historical money flow analysis. Money flow analysis looks at the net flow of funds for mutual funds. Over a period from 1988 through 2009, money flow analysis showed that when the market hit its peak or valley, money flows were at the highest levels.
Money continued to flow into funds until the market hit bottom, and only then did investors start to pull money out of the market and money flows turned negative. The net outflows peaked at market bottoms and continued to be negative even as the market moved into an upward trend. Because the market was shown to fall before funds were sold, and funds were often reinvested after the market had alreayd moved up, it's clear htat investors often fail to time their trades in the most beneficial manner.
A Bright Spot
Despite the strong tendencies that investors portray at the peaks and valleys, they have gotten other periods correct. Throughout the 1990s, there was a steady flow of funds into the market during a period when the market was on a prolonged bull run. Likewise from 2004 to 2007, during another strong bull market, investors poured money into the market. So it can be hypothesized that during periods of very little volatility (such as prolonged bull markets), investors become more comfortable in the market and begin to invest. However, during periods of volatility, or when bull or bear markets begin and end regularly, money flows tend to reflect confusion and the timing of the flows becomes mismatched with actual market movement.
Strategies to Take the Emotion Out of Investing
A 2009 study of investment behavior by DALBAR showed that over the 20-year period from January 1989 to December 2008, the S&P 500 returned an average annual 8.4% but the average stock investor returned only 1.9% annually. The evidence suggests that emotional investing gets the best of the typical investor during periods of uncertainty. There are strategies, however, that can alleviate the guess-work and reduce the effect of poorly timing fund flows.
The most effective tends to be the dollar-cost averaging of investment dollars. Dollar cost averaging is a strategy where equal amounts of dollars are invested at a regular, predetermined interval. This strategy is good during all market conditions. During a downward trend, investors are purchasing shares at cheaper and cheaper prices. During an upward trend, the shares previously held in the portfolio are producing capital gains and fewer shares are being added at the higher price. The key to this strategy is to stay the course- set the strategy and don't tamper with it unless a major change warrants revisiting and rebalancing the established course.
Another technique to diminish the emotional response to market investing is to diversify a portfolio. There have been only a handful of times in history when all markets have moved in unison and diversification provided little protection. In most normal market cycles, the use of a diversification strategy provides downward protection. Diversifying a portfolio can take many forms - investing in different industries, different geographies, different types of investments and even hedging with alternative investments like real estate and private equity. There are distinctive market conditions that favor each of these subsectors of the market, so a portfolio made up of all these various types of investments should provide protection in a range of market conditions.
Conclusion
Investing without emotion is easier said than done, especially because uncertainty rules the market and the media. Evidence suggests that most investors are emotional and maximize money flows at the wrong times - a surefire way to reduce potential returns. Strategies that eliminate the emotional response to investing should produce returns that are significantly greater than those indicated by the typical investor responding to the market rather than proactively investing in the market. Dollar-cost averaging and diversification are two proven strategies within a multitude of other alternatives to reduce an investors emotional reaction to the market.
Investor Behavior
The behavior of investors has been well documented; there are numerous theories that attempt to explain the regret and overreaction that buyers and sellers experience when it comes to money and the potential gains and losses on that money. Investors' psyche overpowers rational thinking during times of stress, whether that stress is a result of euphoria or fear.
The typical non-professional investor is putting his hard-earned cash at stake and, while hoping for a gain, wants to protect that cash against losses. Investors get investment "information" from many sources, such as mainstream media, financial news, friends, family and co-workers. Oftentimes investors get enticed by the market during periods of market calm (low volatility) and prolonged bull markets.
Bull markets are periods when the market tends to go up indiscriminately. During such times of market exuberance, investors tend to listen to stories from friends or family members about how much money they are making in the market, creating a stir and compelling those not invested to test the waters. Likewise, when investors read stories about a bad economy or hear reports about a volatile or negative market period, fear takes over and they sell at the bottom. (Not all investors are mentally prepared for when a much-awaited bull market finally comes charging in.
Bad Timing
The lag between when an event occurs and when it is reported is what typically causes investors to lose money. The media will report a bull market only once it has already hit; unless the trend continues, stocks will retract in upcoming periods. Investors, influenced by the reports, often choose these times of premium valuations to build up their portfolios. It is worrisome when the daily stock market report leads off the mainstream news because it creates a buzz and investors make decisions based on "opinions" that are often outdated. Market uncertainty creates fear and brings about an atmosphere of emotional investing.
Time Tested Theory
The theory that many market participants buy at the top and sell at the bottom has proved to be true based on historical money flow analysis. Money flow analysis looks at the net flow of funds for mutual funds. Over a period from 1988 through 2009, money flow analysis showed that when the market hit its peak or valley, money flows were at the highest levels.
Money continued to flow into funds until the market hit bottom, and only then did investors start to pull money out of the market and money flows turned negative. The net outflows peaked at market bottoms and continued to be negative even as the market moved into an upward trend. Because the market was shown to fall before funds were sold, and funds were often reinvested after the market had alreayd moved up, it's clear htat investors often fail to time their trades in the most beneficial manner.
A Bright Spot
Despite the strong tendencies that investors portray at the peaks and valleys, they have gotten other periods correct. Throughout the 1990s, there was a steady flow of funds into the market during a period when the market was on a prolonged bull run. Likewise from 2004 to 2007, during another strong bull market, investors poured money into the market. So it can be hypothesized that during periods of very little volatility (such as prolonged bull markets), investors become more comfortable in the market and begin to invest. However, during periods of volatility, or when bull or bear markets begin and end regularly, money flows tend to reflect confusion and the timing of the flows becomes mismatched with actual market movement.
Strategies to Take the Emotion Out of Investing
A 2009 study of investment behavior by DALBAR showed that over the 20-year period from January 1989 to December 2008, the S&P 500 returned an average annual 8.4% but the average stock investor returned only 1.9% annually. The evidence suggests that emotional investing gets the best of the typical investor during periods of uncertainty. There are strategies, however, that can alleviate the guess-work and reduce the effect of poorly timing fund flows.
The most effective tends to be the dollar-cost averaging of investment dollars. Dollar cost averaging is a strategy where equal amounts of dollars are invested at a regular, predetermined interval. This strategy is good during all market conditions. During a downward trend, investors are purchasing shares at cheaper and cheaper prices. During an upward trend, the shares previously held in the portfolio are producing capital gains and fewer shares are being added at the higher price. The key to this strategy is to stay the course- set the strategy and don't tamper with it unless a major change warrants revisiting and rebalancing the established course.
Another technique to diminish the emotional response to market investing is to diversify a portfolio. There have been only a handful of times in history when all markets have moved in unison and diversification provided little protection. In most normal market cycles, the use of a diversification strategy provides downward protection. Diversifying a portfolio can take many forms - investing in different industries, different geographies, different types of investments and even hedging with alternative investments like real estate and private equity. There are distinctive market conditions that favor each of these subsectors of the market, so a portfolio made up of all these various types of investments should provide protection in a range of market conditions.
Conclusion
Investing without emotion is easier said than done, especially because uncertainty rules the market and the media. Evidence suggests that most investors are emotional and maximize money flows at the wrong times - a surefire way to reduce potential returns. Strategies that eliminate the emotional response to investing should produce returns that are significantly greater than those indicated by the typical investor responding to the market rather than proactively investing in the market. Dollar-cost averaging and diversification are two proven strategies within a multitude of other alternatives to reduce an investors emotional reaction to the market.
Wednesday, September 8, 2010
Retail Notes: A Simpler Alternative To Bond Funds
You may know that bonds are one way to get income from your investments. You may also know they can help you diversify your portfolio since they often move in the opposite direction of stocks. Yet some people might stay away from bonds because they don't understand how these investments work, or the pricing structure has turned them off to the idea. Here we go over retail notes, which often work as a good alternative to more confusing bond funds.
Bonds Can Be Confusing
With accrued interest, markups, commissions and changing prices, bond investing is not always easy. In 2003, the National Association of Security Dealers (NASD) issued the results of a 55-question investor-literacy survey. The results of survey showed that just 71% of the participants understood the concept of a bond and only 39% knew the inverse relationship between bond prices and interest rates. These numbers may explain why some people avoid bonds.
Diversifying Is Not Always Easy
If you don't understand bond pricing, using bonds to diversify may be difficult to achieve. The typical face value of a corporate bond is $1,000, but if you buy one on the secondary market, you may pay more or less than that amount. The price depends on several factors including prevailing interest rates and credit ratings. Grasping these complex factors can present a roadblock in the attempt to use bonds strategically. (If, however, you would like to start learning, check out Bond Basics .)
As such, to gain some diversification using bonds, many investors invest in bond mutual funds. You can start with a small amount and receive diversification; however, the trouble is that you don't know exactly what income you'll receive while you own the fund (because you own units of a basket of bonds rather than the actual bonds, which you would own if you bought the bonds yourself). There are also ongoing fees that you pay to the fund company to manage your investment.
When interest rates are falling, it's easy to ignore these fees because the value of the fund's shares goes up (remember bond prices and interest rates have an inverse relationship). But when interest rates rise, expenses could consume a larger portion of your returns. Plus, a bond fund has no maturity date, so there is no point in time when you are assured of getting back your original investment (as you are when you own a bond directly).
Finally, bond funds also present a potential tax problem. Many owners of taxable bond funds aren't very happy when they get their Form 1099 from their funds. These shareholders often realize that they do not have complete control over when they must take capital gains (short or long term) and how they can get hit with taxes even if they haven't sold any of their shares.
For instance, when interest rates start to rise, the bond fund's share value can drop. This might cause other fund holders to panic and sell. Fund managers then need the cash to meet the redemptions, so they have to sell bonds that may have appreciated, and must pass that growth to each shareholder, even if the money is reinvested in additional fund shares. Thus, shareholders who stayed in the fund end up with a distribution that they didn't even want, but they still have to pay the associated tax on that distribution. And to make bad matters worse, they might have to pay tax while their fund's value is falling.
Retail Notes Offer Another Option
There is another choice for income-seeking investors that is easy to understand and inexpensive to buy. Retail notes are fixed-income securities that you can purchase directly from the issuer at par in $1,000 increments with no accrued interest or added markups. They are fixed-rate subordinated, unsecured obligations of the issuing company. The notes and accompanying interest payments are backed by the full faith and credit of the issuer and are either callable or non-callable. The callable notes usually provide higher yields and include call protection for a set time (for further reading on callable securities, see Call Features: Don't Get Caught Off Guard.). Once you buy the notes, you will receive regular fixed-interest payments (monthly, quarterly or semi-annually) until maturity.
The notes are offered weekly by a limited number of issuers, many of which are top-rated, well-known international corporations. The offers are valid for one week and include a series of coupon rates, maturities, interest-payment frequencies, call dates and credit ratings. Issuers, however, have the right to change or cancel an offering without notice. You can invest in these securities through a broker who can provide you with the weekly postings.
These notes are suitable for fully taxable accounts, or you can put them in your IRA, where the interest income accumulates tax deferred. And investors who want to create an income (bond) ladder can purchase retail notes with different maturity dates and interest-payment schedules.
Even though there might be a secondary market for retail notes, they are meant to be held until maturity. Therefore, they are not suitable if you are looking to trade them for the capital gains (but this is the kind of fixed-income strategy that presents the complexities we discussed above). But like other fixed-income investments, the market value of retail notes can fluctuate until maturity.
Finally, most retail notes have a unique survivor's option. This feature gives your estate the ability to return the notes back to the issuer at par value. Therefore, just in case the note is worth less than par value when you die, your heirs can still return the notes for par value.
The Bottom Line
If you are looking to include or increase the amount of fixed assets in your portfolio, retail notes can make your investing easier. They are simple to understand, can be purchased for a moderate amount, and provide a stable income. Plus, they're often a whole lot simpler than bond funds, which is something that any time-strapped investor is likely to appreciate.
Bonds Can Be Confusing
With accrued interest, markups, commissions and changing prices, bond investing is not always easy. In 2003, the National Association of Security Dealers (NASD) issued the results of a 55-question investor-literacy survey. The results of survey showed that just 71% of the participants understood the concept of a bond and only 39% knew the inverse relationship between bond prices and interest rates. These numbers may explain why some people avoid bonds.
Diversifying Is Not Always Easy
If you don't understand bond pricing, using bonds to diversify may be difficult to achieve. The typical face value of a corporate bond is $1,000, but if you buy one on the secondary market, you may pay more or less than that amount. The price depends on several factors including prevailing interest rates and credit ratings. Grasping these complex factors can present a roadblock in the attempt to use bonds strategically. (If, however, you would like to start learning, check out Bond Basics .)
As such, to gain some diversification using bonds, many investors invest in bond mutual funds. You can start with a small amount and receive diversification; however, the trouble is that you don't know exactly what income you'll receive while you own the fund (because you own units of a basket of bonds rather than the actual bonds, which you would own if you bought the bonds yourself). There are also ongoing fees that you pay to the fund company to manage your investment.
When interest rates are falling, it's easy to ignore these fees because the value of the fund's shares goes up (remember bond prices and interest rates have an inverse relationship). But when interest rates rise, expenses could consume a larger portion of your returns. Plus, a bond fund has no maturity date, so there is no point in time when you are assured of getting back your original investment (as you are when you own a bond directly).
Finally, bond funds also present a potential tax problem. Many owners of taxable bond funds aren't very happy when they get their Form 1099 from their funds. These shareholders often realize that they do not have complete control over when they must take capital gains (short or long term) and how they can get hit with taxes even if they haven't sold any of their shares.
For instance, when interest rates start to rise, the bond fund's share value can drop. This might cause other fund holders to panic and sell. Fund managers then need the cash to meet the redemptions, so they have to sell bonds that may have appreciated, and must pass that growth to each shareholder, even if the money is reinvested in additional fund shares. Thus, shareholders who stayed in the fund end up with a distribution that they didn't even want, but they still have to pay the associated tax on that distribution. And to make bad matters worse, they might have to pay tax while their fund's value is falling.
Retail Notes Offer Another Option
There is another choice for income-seeking investors that is easy to understand and inexpensive to buy. Retail notes are fixed-income securities that you can purchase directly from the issuer at par in $1,000 increments with no accrued interest or added markups. They are fixed-rate subordinated, unsecured obligations of the issuing company. The notes and accompanying interest payments are backed by the full faith and credit of the issuer and are either callable or non-callable. The callable notes usually provide higher yields and include call protection for a set time (for further reading on callable securities, see Call Features: Don't Get Caught Off Guard.). Once you buy the notes, you will receive regular fixed-interest payments (monthly, quarterly or semi-annually) until maturity.
The notes are offered weekly by a limited number of issuers, many of which are top-rated, well-known international corporations. The offers are valid for one week and include a series of coupon rates, maturities, interest-payment frequencies, call dates and credit ratings. Issuers, however, have the right to change or cancel an offering without notice. You can invest in these securities through a broker who can provide you with the weekly postings.
These notes are suitable for fully taxable accounts, or you can put them in your IRA, where the interest income accumulates tax deferred. And investors who want to create an income (bond) ladder can purchase retail notes with different maturity dates and interest-payment schedules.
Even though there might be a secondary market for retail notes, they are meant to be held until maturity. Therefore, they are not suitable if you are looking to trade them for the capital gains (but this is the kind of fixed-income strategy that presents the complexities we discussed above). But like other fixed-income investments, the market value of retail notes can fluctuate until maturity.
Finally, most retail notes have a unique survivor's option. This feature gives your estate the ability to return the notes back to the issuer at par value. Therefore, just in case the note is worth less than par value when you die, your heirs can still return the notes for par value.
The Bottom Line
If you are looking to include or increase the amount of fixed assets in your portfolio, retail notes can make your investing easier. They are simple to understand, can be purchased for a moderate amount, and provide a stable income. Plus, they're often a whole lot simpler than bond funds, which is something that any time-strapped investor is likely to appreciate.
Tuesday, September 7, 2010
Advanced Bond Concepts: Duration
The term duration has a special meaning in the context of bonds. It is a measurement of how long, in years, it takes for the price of a bond to be repaid by its internal cash flows. It is an important measure for investors to consider, as bonds with higher durations carry more risk and have higher price volatility than bonds with lower durations.
For each of the two basic types of bonds the duration is the following:
1. Zero-Coupon Bond – Duration is equal to its time to maturity.
2. Vanilla Bond - Duration will always be less than its time to maturity.
Let's first work through some visual models that demonstrate the properties of duration for a zero-coupon bond and a vanilla bond.
Duration of a Zero-Coupon Bond

The red lever above represents the four-year time period it takes for a zero-coupon bond to mature. The money bag balancing on the far right represents the future value of the bond, the amount that will be paid to the bondholder at maturity. The fulcrum, or the point holding the lever, represents duration, which must be positioned where the red lever is balanced. The fulcrum balances the red lever at the point on the time line at which the amount paid for the bond and the cash flow received from the bond are equal. The entire cash flow of a zero-coupon bond occurs at maturity, so the fulcrum is located directly below this one payment.
Duration of a Vanilla or Straight Bond
Consider a vanilla bond that pays coupons annually and matures in five years. Its cash flows consist of five annual coupon payments and the last payment includes the face value of the bond.

The moneybags represent the cash flows you will receive over the five-year period. To balance the red lever at the point where total cash flows equal the amount paid for the bond, the fulcrum must be farther to the left, at a point before maturity. Unlike the zero-coupon bond, the straight bond pays coupon payments throughout its life and therefore repays the full amount paid for the bond sooner.
Factors Affecting Duration
It is important to note, however, that duration changes as the coupons are paid to the bondholder. As the bondholder receives a coupon payment, the amount of the cash flow is no longer on the time line, which means it is no longer counted as a future cash flow that goes towards repaying the bondholder. Our model of the fulcrum demonstrates this: as the first coupon payment is removed from the red lever and paid to the bondholder, the lever is no longer in balance because the coupon payment is no longer counted as a future cash flow.

The fulcrum must now move to the right in order to balance the lever again:

Duration increases immediately on the day a coupon is paid, but throughout the life of the bond, the duration is continually decreasing as time to the bond's maturity decreases. The movement of time is represented above as the shortening of the red lever. Notice how the first diagram had five payment periods and the above diagram has only four. This shortening of the time line, however, occurs gradually, and as it does, duration continually decreases. So, in summary, duration is decreasing as time moves closer to maturity, but duration also increases momentarily on the day a coupon is paid and removed from the series of future cash flows - all this occurs until duration, eventually converges with the bond's maturity. The same is true for a zero-coupon bond
Duration: Other factors
Besides the movement of time and the payment of coupons, there are other factors that affect a bond's duration: the coupon rate and its yield. Bonds with high coupon rates and, in turn, high yields will tend to have lower durations than bonds that pay low coupon rates or offer low yields. This makes empirical sense, because when a bond pays a higher coupon rate or has a high yield, the holder of the security receives repayment for the security at a faster rate. The diagram below summarizes how duration changes with coupon rate and yield.

Types of Duration
There are four main types of duration calculations, each of which differ in the way they account for factors such as interest rate changes and the bond's embedded options or redemption features. The four types of durations are Macaulay duration, modified duration, effective duration and key-rate duration.
Macaulay Duration
The formula usually used to calculate a bond's basic duration is the Macaulay duration, which was created by Frederick Macaulay in 1938, although it was not commonly used until the 1970s. Macaulay duration is calculated by adding the results of multiplying the present value of each cash flow by the time it is received and dividing by the total price of the security. The formula for Macaulay duration is as follows:

n = number of cash flows
t = time to maturity
C = cash flow
i = required yield
M = maturity (par) value
P = bond price
Remember that bond price equals:

So the following is an expanded version of Macaulay duration:

Example 1: Betty holds a five-year bond with a par value of $1,000 and coupon rate of 5%. For simplicity, let's assume that the coupon is paid annually and that interest rates are 5%. What is the Macaulay duration of the bond?


= 4.55 years
Fortunately, if you are seeking the Macaulay duration of a zero-coupon bond, the duration would be equal to the bond's maturity, so there is no calculation required.
Modified Duration
Modified duration is a modified version of the Macaulay model that accounts for changing interest rates. Because they affect yield, fluctuating interest rates will affect duration, so this modified formula shows how much the duration changes for each percentage change in yield. For bonds without any embedded features, bond price and interest rate move in opposite directions, so there is an inverse relationship between modified duration and an approximate 1% change in yield. Because the modified duration formula shows how a bond's duration changes in relation to interest rate movements, the formula is appropriate for investors wishing to measure the volatility of a particular bond. Modified duration is calculated as the following:

OR

Let's continue to analyze Betty's bond and run through the calculation of her modified duration. Currently her bond is selling at $1,000, or par, which translates
to a yield to maturity of 5%. Remember that we calculated a Macaulay duration of 4.55.

= 4.33 years
Our example shows that if the bond's yield changed from 5% to 6%, the duration of the bond will decline to 4.33 years. Because it calculates how duration will change when interest increases by 100 basis points, the modified duration will always be lower than the Macaulay duration.
Effective Duration
The modified duration formula discussed above assumes that the expected cash flows will remain constant, even if prevailing interest rates change; this is also the case for option-free fixed-income securities. On the other hand, cash flows from securities with embedded options or redemption features will change when interest rates change. For calculating the duration of these types of bonds, effective duration is the most appropriate.
Effective duration requires the use of binomial trees to calculate the option-adjusted spread (OAS). There are entire courses built around just those two topics, so the calculations involved for effective duration are beyond the scope of this tutorial. There are, however, many programs available to investors wishing to calculate effective duration.
Key-Rate Duration
The final duration calculation to learn is key-rate duration, which calculates the spot durations of each of the 11 “key” maturities along a spot rate curve. These 11 key maturities are at the three-month and one, two, three, five, seven, 10, 15, 20, 25, and 30-year portions of the curve.
In essence, key-rate duration, while holding the yield for all other maturities constant, allows the duration of a portfolio to be calculated for a one-basis-point change in interest rates. The key-rate method is most often used for portfolios such as the bond ladder, which consists of fixed-income securities with differing maturities. Here is the formula for key-rate duration:

The sum of the key-rate durations along the curve is equal to the effective duration.
Duration and Bond Price Volatility
More than once throughout this tutorial, we have established that when interest rates rise, bond prices fall, and vice versa. But how does one determine the degree of a price change when interest rates change? Generally, bonds with a high duration will have a higher price fluctuation than bonds with a low duration. But it is important to know that there are also three other factors that determine how sensitive a bond's price is to changes in interest rates. These factors are term to maturity, coupon rate and yield to maturity. Knowing what affects a bond's volatility is important to investors who use duration-based immunization strategies, which we discuss below, in their portfolios.
Factors 1 and 2: Coupon rate and Term to Maturity
If term to maturity and a bond's initial price remain constant, the higher the coupon, the lower the volatility, and the lower the coupon, the higher the volatility. If the coupon rate and the bond's initial price are constant, the bond with a longer term to maturity will display higher price volatility and a bond with a shorter term to maturity will display lower price volatility.
Therefore, if you would like to invest in a bond with minimal interest rate risk, a bond with high coupon payments and a short term to maturity would be optimal. An investor who predicts that interest rates will decline would best potentially capitalize on a bond with low coupon payments and a long term to maturity, since these factors would magnify a bond's price increase.
Factor 3: Yield to Maturity (YTM)
The sensitivity of a bond's price to changes in interest rates also depends on its yield to maturity. A bond with a high yield to maturity will display lower price volatility than a bond with a lower yield to maturity, but a similar coupon rate and term to maturity. Yield to maturity is affected by the bond's credit rating, so bonds with poor credit ratings will have higher yields than bonds with excellent credit ratings. Therefore, bonds with poor credit ratings typically display lower price volatility than bonds with excellent credit ratings.
All three factors affect the degree to which bond price will change in the face of a change in prevailing interest rates. These factors work together and against each other. Consider the chart below:

So, if a bond has both a short term to maturity and a low coupon rate, its characteristics have opposite effects on its volatility: the low coupon raises volatility and the short term to maturity lowers volatility. The bond's volatility would then be an average of these two opposite effects.
Immunization
As we mentioned in the above section, the interrelated factors of duration, coupon rate, term to maturity and price volatility are important for those investors employing duration-based immunization strategies. These strategies aim to match the durations of assets and liabilities within a portfolio for the purpose of minimizing the impact of interest rates on the net worth. To create these strategies, portfolio managers use Macaulay duration.
For example, say a bond has a two-year term with four coupons of $50 and a par value of $1,000. If the investor did not reinvest his or her proceeds at some interest rate, he or she would have received a total of $1200 at the end of two years. However, if the investor were to reinvest each of the bond cash flows until maturity, he or she would have more than $1200 in two years. Therefore, the extra interest accumulated on the reinvested coupons would allow the bondholder to satisfy a future $1200 obligation in less time than the maturity of the bond.
Understanding what duration is, how it is used and what factors affect it will help you to determine a bond's price volatility. Volatility is an important factor in determining your strategy for capitalizing on interest rate movements. Furthermore, duration will also help you to determine how you can protect your portfolio from interest rate risk.
For each of the two basic types of bonds the duration is the following:
1. Zero-Coupon Bond – Duration is equal to its time to maturity.
2. Vanilla Bond - Duration will always be less than its time to maturity.
Let's first work through some visual models that demonstrate the properties of duration for a zero-coupon bond and a vanilla bond.
Duration of a Zero-Coupon Bond

The red lever above represents the four-year time period it takes for a zero-coupon bond to mature. The money bag balancing on the far right represents the future value of the bond, the amount that will be paid to the bondholder at maturity. The fulcrum, or the point holding the lever, represents duration, which must be positioned where the red lever is balanced. The fulcrum balances the red lever at the point on the time line at which the amount paid for the bond and the cash flow received from the bond are equal. The entire cash flow of a zero-coupon bond occurs at maturity, so the fulcrum is located directly below this one payment.
Duration of a Vanilla or Straight Bond
Consider a vanilla bond that pays coupons annually and matures in five years. Its cash flows consist of five annual coupon payments and the last payment includes the face value of the bond.

The moneybags represent the cash flows you will receive over the five-year period. To balance the red lever at the point where total cash flows equal the amount paid for the bond, the fulcrum must be farther to the left, at a point before maturity. Unlike the zero-coupon bond, the straight bond pays coupon payments throughout its life and therefore repays the full amount paid for the bond sooner.
Factors Affecting Duration
It is important to note, however, that duration changes as the coupons are paid to the bondholder. As the bondholder receives a coupon payment, the amount of the cash flow is no longer on the time line, which means it is no longer counted as a future cash flow that goes towards repaying the bondholder. Our model of the fulcrum demonstrates this: as the first coupon payment is removed from the red lever and paid to the bondholder, the lever is no longer in balance because the coupon payment is no longer counted as a future cash flow.

The fulcrum must now move to the right in order to balance the lever again:

Duration increases immediately on the day a coupon is paid, but throughout the life of the bond, the duration is continually decreasing as time to the bond's maturity decreases. The movement of time is represented above as the shortening of the red lever. Notice how the first diagram had five payment periods and the above diagram has only four. This shortening of the time line, however, occurs gradually, and as it does, duration continually decreases. So, in summary, duration is decreasing as time moves closer to maturity, but duration also increases momentarily on the day a coupon is paid and removed from the series of future cash flows - all this occurs until duration, eventually converges with the bond's maturity. The same is true for a zero-coupon bond
Duration: Other factors
Besides the movement of time and the payment of coupons, there are other factors that affect a bond's duration: the coupon rate and its yield. Bonds with high coupon rates and, in turn, high yields will tend to have lower durations than bonds that pay low coupon rates or offer low yields. This makes empirical sense, because when a bond pays a higher coupon rate or has a high yield, the holder of the security receives repayment for the security at a faster rate. The diagram below summarizes how duration changes with coupon rate and yield.

Types of Duration
There are four main types of duration calculations, each of which differ in the way they account for factors such as interest rate changes and the bond's embedded options or redemption features. The four types of durations are Macaulay duration, modified duration, effective duration and key-rate duration.
Macaulay Duration
The formula usually used to calculate a bond's basic duration is the Macaulay duration, which was created by Frederick Macaulay in 1938, although it was not commonly used until the 1970s. Macaulay duration is calculated by adding the results of multiplying the present value of each cash flow by the time it is received and dividing by the total price of the security. The formula for Macaulay duration is as follows:

n = number of cash flows
t = time to maturity
C = cash flow
i = required yield
M = maturity (par) value
P = bond price
Remember that bond price equals:

So the following is an expanded version of Macaulay duration:

Example 1: Betty holds a five-year bond with a par value of $1,000 and coupon rate of 5%. For simplicity, let's assume that the coupon is paid annually and that interest rates are 5%. What is the Macaulay duration of the bond?


= 4.55 years
Fortunately, if you are seeking the Macaulay duration of a zero-coupon bond, the duration would be equal to the bond's maturity, so there is no calculation required.
Modified Duration
Modified duration is a modified version of the Macaulay model that accounts for changing interest rates. Because they affect yield, fluctuating interest rates will affect duration, so this modified formula shows how much the duration changes for each percentage change in yield. For bonds without any embedded features, bond price and interest rate move in opposite directions, so there is an inverse relationship between modified duration and an approximate 1% change in yield. Because the modified duration formula shows how a bond's duration changes in relation to interest rate movements, the formula is appropriate for investors wishing to measure the volatility of a particular bond. Modified duration is calculated as the following:

OR

Let's continue to analyze Betty's bond and run through the calculation of her modified duration. Currently her bond is selling at $1,000, or par, which translates
to a yield to maturity of 5%. Remember that we calculated a Macaulay duration of 4.55.

= 4.33 years
Our example shows that if the bond's yield changed from 5% to 6%, the duration of the bond will decline to 4.33 years. Because it calculates how duration will change when interest increases by 100 basis points, the modified duration will always be lower than the Macaulay duration.
Effective Duration
The modified duration formula discussed above assumes that the expected cash flows will remain constant, even if prevailing interest rates change; this is also the case for option-free fixed-income securities. On the other hand, cash flows from securities with embedded options or redemption features will change when interest rates change. For calculating the duration of these types of bonds, effective duration is the most appropriate.
Effective duration requires the use of binomial trees to calculate the option-adjusted spread (OAS). There are entire courses built around just those two topics, so the calculations involved for effective duration are beyond the scope of this tutorial. There are, however, many programs available to investors wishing to calculate effective duration.
Key-Rate Duration
The final duration calculation to learn is key-rate duration, which calculates the spot durations of each of the 11 “key” maturities along a spot rate curve. These 11 key maturities are at the three-month and one, two, three, five, seven, 10, 15, 20, 25, and 30-year portions of the curve.
In essence, key-rate duration, while holding the yield for all other maturities constant, allows the duration of a portfolio to be calculated for a one-basis-point change in interest rates. The key-rate method is most often used for portfolios such as the bond ladder, which consists of fixed-income securities with differing maturities. Here is the formula for key-rate duration:

The sum of the key-rate durations along the curve is equal to the effective duration.
Duration and Bond Price Volatility
More than once throughout this tutorial, we have established that when interest rates rise, bond prices fall, and vice versa. But how does one determine the degree of a price change when interest rates change? Generally, bonds with a high duration will have a higher price fluctuation than bonds with a low duration. But it is important to know that there are also three other factors that determine how sensitive a bond's price is to changes in interest rates. These factors are term to maturity, coupon rate and yield to maturity. Knowing what affects a bond's volatility is important to investors who use duration-based immunization strategies, which we discuss below, in their portfolios.
Factors 1 and 2: Coupon rate and Term to Maturity
If term to maturity and a bond's initial price remain constant, the higher the coupon, the lower the volatility, and the lower the coupon, the higher the volatility. If the coupon rate and the bond's initial price are constant, the bond with a longer term to maturity will display higher price volatility and a bond with a shorter term to maturity will display lower price volatility.
Therefore, if you would like to invest in a bond with minimal interest rate risk, a bond with high coupon payments and a short term to maturity would be optimal. An investor who predicts that interest rates will decline would best potentially capitalize on a bond with low coupon payments and a long term to maturity, since these factors would magnify a bond's price increase.
Factor 3: Yield to Maturity (YTM)
The sensitivity of a bond's price to changes in interest rates also depends on its yield to maturity. A bond with a high yield to maturity will display lower price volatility than a bond with a lower yield to maturity, but a similar coupon rate and term to maturity. Yield to maturity is affected by the bond's credit rating, so bonds with poor credit ratings will have higher yields than bonds with excellent credit ratings. Therefore, bonds with poor credit ratings typically display lower price volatility than bonds with excellent credit ratings.
All three factors affect the degree to which bond price will change in the face of a change in prevailing interest rates. These factors work together and against each other. Consider the chart below:

So, if a bond has both a short term to maturity and a low coupon rate, its characteristics have opposite effects on its volatility: the low coupon raises volatility and the short term to maturity lowers volatility. The bond's volatility would then be an average of these two opposite effects.
Immunization
As we mentioned in the above section, the interrelated factors of duration, coupon rate, term to maturity and price volatility are important for those investors employing duration-based immunization strategies. These strategies aim to match the durations of assets and liabilities within a portfolio for the purpose of minimizing the impact of interest rates on the net worth. To create these strategies, portfolio managers use Macaulay duration.
For example, say a bond has a two-year term with four coupons of $50 and a par value of $1,000. If the investor did not reinvest his or her proceeds at some interest rate, he or she would have received a total of $1200 at the end of two years. However, if the investor were to reinvest each of the bond cash flows until maturity, he or she would have more than $1200 in two years. Therefore, the extra interest accumulated on the reinvested coupons would allow the bondholder to satisfy a future $1200 obligation in less time than the maturity of the bond.
Understanding what duration is, how it is used and what factors affect it will help you to determine a bond's price volatility. Volatility is an important factor in determining your strategy for capitalizing on interest rate movements. Furthermore, duration will also help you to determine how you can protect your portfolio from interest rate risk.
Monday, September 6, 2010
Advanced Bond Concepts: Yield and Bond Price
In the last section of this tutorial, we touched on the concept of required yield. In this section we'll explain what this means and take a closer look into how various yields are calculated.
The general definition of yield is the return an investor will receive by holding a bond to maturity. So if you want to know what your bond investment will earn, you should know how to calculate yield. Required yield, on the other hand, is the yield or return a bond must offer in order for it to be worthwhile for the investor. The required yield of a bond is usually the yield offered by other plain vanilla bonds that are currently offered in the market and have similar credit quality and maturity.
Once an investor has decided on the required yield, he or she must calculate the yield of a bond he or she wants to buy. Let's proceed and examine these calculations.
Calculating Current Yield
A simple yield calculation that is often used to calculate the yield on both bonds and the dividend yield for stocks is the current yield. The current yield calculates the percentage return that the annual coupon payment provides the investor. In other words, this yield calculates what percentage the actual dollar coupon payment is of the price the investor pays for the bond. The multiplication by 100 in the formulas below converts the decimal into a percentage, allowing us to see the percentage return:

So, if you purchased a bond with a par value of $100 for $95.92 and it paid a coupon rate of 5%, this is how you'd calculate its current yield:

Notice how this calculation does not include any capital gains or losses the investor would make if the bond were bought at a discount or premium. Because the comparison of the bond price to its par value is a factor that affects the actual current yield, the above formula would give a slightly inaccurate answer - unless of course the investor pays par value for the bond. To correct this, investors can modify the current yield formula by adding the result of the current yield to the gain or loss the price gives the investor: [(Par Value – Bond Price)/Years to Maturity]. The modified current yield formula then takes into account the discount or premium at which the investor bought the bond. This is the full calculation:

Let's re-calculate the yield of the bond in our first example, which matures in 30 months and has a coupon payment of $5:

The adjusted current yield of 6.84% is higher than the current yield of 5.21% because the bond's discounted price ($95.92 instead of $100) gives the investor more of a gain on the investment.
One thing to note, however, is whether you buy the bond between coupon payments. If you do, remember to use the dirty price in place of the market price in the above equation. The dirty price is what you will actually pay for the bond, but usually the figure quoted in U.S. markets is the clean price.
Now we must also account for other factors such as the coupon payment for a zero-coupon bond, which has only one coupon payment. For such a bond, the yield calculation would be as follows:

n = years left until maturity
If we were considering a zero-coupon bond that has a future value of $1,000 that matures in two years and can be currently purchased for $925, we would calculate its current yield with the following formula:

Calculating Yield to Maturity
The current yield calculation we learned above shows us the return the annual coupon payment gives the investor, but this percentage does not take into account the time value of money or, more specifically, the present value of the coupon payments the investor will receive in the future. For this reason, when investors and analysts refer to yield, they are most often referring to the yield to maturity (YTM), which is the interest rate by which the present values of all the future cash flows are equal to the bond's price.
An easy way to think of YTM is to consider it the resulting interest rate the investor receives if he or she invests all of his or her cash flows (coupons payments) at a constant interest rate until the bond matures. YTM is the return the investor will receive from his or her entire investment. It is the return that an investor gains by receiving the present values of the coupon payments, the par value and capital gains in relation to the price that is paid.
The yield to maturity, however, is an interest rate that must be calculated through trial and error. Such a method of valuation is complicated and can be time consuming, so investors (whether professional or private) will typically use a financial calculator or program that is quickly able to run through the process of trial and error. If you don't have such a program, you can use an approximation method that does not require any serious mathematics.
To demonstrate this method, we first need to review the relationship between a bond's price and its yield. In general, as a bond's price increases, yield decreases. This relationship is measured using the price value of a basis point (PVBP). By taking into account factors such as the bond's coupon rate and credit rating, the PVBP measures the degree to which a bond's price will change when there is a 0.01% change in interest rates.
The charted relationship between bond price and required yield appears as a negative curve:

This is due to the fact that a bond's price will be higher when it pays a coupon that is higher than prevailing interest rates. As market interest rates increase, bond prices decrease.
The second concept we need to review is the basic price-yield properties of bonds:
Premium bond: Coupon rate is greater than market interest rates.
Discount bond: Coupon rate is less than market interest rates.
Thirdly, remember to think of YTM as the yield a bondholder receives if he or she reinvested all coupons received at a constant interest rate, which is the interest rate that we are solving for. If we were to add the present values of all future cash flows, we would end up with the market value or purchase price of the bond.
The calculation can be presented as:

OR

Example 1: You hold a bond whose par value is $100 but has a current yield of 5.21% because the bond is priced at $95.92. The bond matures in 30 months and pays a semi-annual coupon of 5%.
1. Determine the Cash Flows: Every six months you would receive a coupon payment of $2.50 (0.025*100). In total, you would receive five payments of $2.50, plus the future value of $100.
2. Plug the Known Amounts into the YTM Formula:

Remember that we are trying to find the semi-annual interest rate, as the bond pays the coupon semi-annually.
3. Guess and Check: Now for the tough part: solving for “i,” or the interest rate. Rather than pick random numbers, we can start by considering the relationship between bond price and yield. When a bond is priced at par, the interest rate is equal to the coupon rate. If the bond is priced above par (at a premium), the coupon rate is greater than the interest rate. In our case, the bond is priced at a discount from par, so the annual interest rate we are seeking (like the current yield) must be greater than the coupon rate of 5%.
Now that we know this, we can calculate a number of bond prices by plugging various annual interest rates that are higher than 5% into the above formula. Here is a table of the bond prices that result from a few different interest rates:

Because our bond price is $95.52, our list shows that the interest rate we are solving for is between 6%, which gives a price of $95, and 7%, which gives a price of $98. Now that we have found a range between which the interest rate lies, we can make another table showing the prices that result from a series of interest rates that go up in increments of 0.1% instead of 1.0%. Below we see the bond prices that result from various interest rates that are between 6.0% and 7.0%:

We see then that the present value of our bond (the price) is equal to $95.92 when we have an interest rate of 6.8%. If at this point we did not find that 6.8% gives us the exact price that we are paying for the bond, we would have to make another table that shows the interest rates in 0.01% increments. You can see why investors prefer to use special programs to narrow down the interest rates - the calculations required to find YTM can be quite numerous!
Calculating Yield for Callable and Puttable Bonds
Bonds with callable or puttable redemption features have additional yield calculations. A callable bond's valuations must account for the issuer's ability to call the bond on the call date and the puttable bond's valuation must include the buyer's ability to sell the bond at the pre-specified put date. The yield for callable bonds is referred to as yield-to-call, and the yield for puttable bonds is referred to as yield-to-put.
Yield to call (YTC) is the interest rate that investors would receive if they held the bond until the call date. The period until the first call is referred to as the call protection period. Yield to call is the rate that would make the bond's present value equal to the full price of the bond. Essentially, its calculation requires two simple modifications to the yield-to-maturity formula:
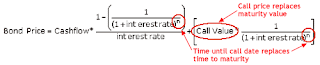
Note that European callable bonds can have multiple call dates and that a yield to call can be calculated for each.
Yield to put (YTP) is the interest rate that investors would receive if they held the bond until its put date. To calculate yield to put, the same modified equation for yield to call is used except the bond put price replaces the bond call value and the time until put date replaces the time until call date.
For both callable and puttable bonds, astute investors will compute both yield and all yield-to-call/yield-to-put figures for a particular bond, and then use these figures to estimate the expected yield. The lowest yield calculated is known as yield to worst, which is commonly used by conservative investors when calculating their expected yield. Unfortunately, these yield figures do not account for bonds that are not redeemed or are sold prior to the call or put date.
Now you know that the yield you receive from holding a bond will differ from its coupon rate because of fluctuations in bond price and from the reinvestment of coupon payments. In addition, you are now able to differentiate between current yield and yield to maturity. In our next section we will take a closer look at yield to maturity and how the YTMs for bonds are graphed to form the term structure of interest rates, or yield curve.
The general definition of yield is the return an investor will receive by holding a bond to maturity. So if you want to know what your bond investment will earn, you should know how to calculate yield. Required yield, on the other hand, is the yield or return a bond must offer in order for it to be worthwhile for the investor. The required yield of a bond is usually the yield offered by other plain vanilla bonds that are currently offered in the market and have similar credit quality and maturity.
Once an investor has decided on the required yield, he or she must calculate the yield of a bond he or she wants to buy. Let's proceed and examine these calculations.
Calculating Current Yield
A simple yield calculation that is often used to calculate the yield on both bonds and the dividend yield for stocks is the current yield. The current yield calculates the percentage return that the annual coupon payment provides the investor. In other words, this yield calculates what percentage the actual dollar coupon payment is of the price the investor pays for the bond. The multiplication by 100 in the formulas below converts the decimal into a percentage, allowing us to see the percentage return:

So, if you purchased a bond with a par value of $100 for $95.92 and it paid a coupon rate of 5%, this is how you'd calculate its current yield:

Notice how this calculation does not include any capital gains or losses the investor would make if the bond were bought at a discount or premium. Because the comparison of the bond price to its par value is a factor that affects the actual current yield, the above formula would give a slightly inaccurate answer - unless of course the investor pays par value for the bond. To correct this, investors can modify the current yield formula by adding the result of the current yield to the gain or loss the price gives the investor: [(Par Value – Bond Price)/Years to Maturity]. The modified current yield formula then takes into account the discount or premium at which the investor bought the bond. This is the full calculation:

Let's re-calculate the yield of the bond in our first example, which matures in 30 months and has a coupon payment of $5:

The adjusted current yield of 6.84% is higher than the current yield of 5.21% because the bond's discounted price ($95.92 instead of $100) gives the investor more of a gain on the investment.
One thing to note, however, is whether you buy the bond between coupon payments. If you do, remember to use the dirty price in place of the market price in the above equation. The dirty price is what you will actually pay for the bond, but usually the figure quoted in U.S. markets is the clean price.
Now we must also account for other factors such as the coupon payment for a zero-coupon bond, which has only one coupon payment. For such a bond, the yield calculation would be as follows:

n = years left until maturity
If we were considering a zero-coupon bond that has a future value of $1,000 that matures in two years and can be currently purchased for $925, we would calculate its current yield with the following formula:

Calculating Yield to Maturity
The current yield calculation we learned above shows us the return the annual coupon payment gives the investor, but this percentage does not take into account the time value of money or, more specifically, the present value of the coupon payments the investor will receive in the future. For this reason, when investors and analysts refer to yield, they are most often referring to the yield to maturity (YTM), which is the interest rate by which the present values of all the future cash flows are equal to the bond's price.
An easy way to think of YTM is to consider it the resulting interest rate the investor receives if he or she invests all of his or her cash flows (coupons payments) at a constant interest rate until the bond matures. YTM is the return the investor will receive from his or her entire investment. It is the return that an investor gains by receiving the present values of the coupon payments, the par value and capital gains in relation to the price that is paid.
The yield to maturity, however, is an interest rate that must be calculated through trial and error. Such a method of valuation is complicated and can be time consuming, so investors (whether professional or private) will typically use a financial calculator or program that is quickly able to run through the process of trial and error. If you don't have such a program, you can use an approximation method that does not require any serious mathematics.
To demonstrate this method, we first need to review the relationship between a bond's price and its yield. In general, as a bond's price increases, yield decreases. This relationship is measured using the price value of a basis point (PVBP). By taking into account factors such as the bond's coupon rate and credit rating, the PVBP measures the degree to which a bond's price will change when there is a 0.01% change in interest rates.
The charted relationship between bond price and required yield appears as a negative curve:

This is due to the fact that a bond's price will be higher when it pays a coupon that is higher than prevailing interest rates. As market interest rates increase, bond prices decrease.
The second concept we need to review is the basic price-yield properties of bonds:
Premium bond: Coupon rate is greater than market interest rates.
Discount bond: Coupon rate is less than market interest rates.
Thirdly, remember to think of YTM as the yield a bondholder receives if he or she reinvested all coupons received at a constant interest rate, which is the interest rate that we are solving for. If we were to add the present values of all future cash flows, we would end up with the market value or purchase price of the bond.
The calculation can be presented as:

OR

Example 1: You hold a bond whose par value is $100 but has a current yield of 5.21% because the bond is priced at $95.92. The bond matures in 30 months and pays a semi-annual coupon of 5%.
1. Determine the Cash Flows: Every six months you would receive a coupon payment of $2.50 (0.025*100). In total, you would receive five payments of $2.50, plus the future value of $100.
2. Plug the Known Amounts into the YTM Formula:

Remember that we are trying to find the semi-annual interest rate, as the bond pays the coupon semi-annually.
3. Guess and Check: Now for the tough part: solving for “i,” or the interest rate. Rather than pick random numbers, we can start by considering the relationship between bond price and yield. When a bond is priced at par, the interest rate is equal to the coupon rate. If the bond is priced above par (at a premium), the coupon rate is greater than the interest rate. In our case, the bond is priced at a discount from par, so the annual interest rate we are seeking (like the current yield) must be greater than the coupon rate of 5%.
Now that we know this, we can calculate a number of bond prices by plugging various annual interest rates that are higher than 5% into the above formula. Here is a table of the bond prices that result from a few different interest rates:

Because our bond price is $95.52, our list shows that the interest rate we are solving for is between 6%, which gives a price of $95, and 7%, which gives a price of $98. Now that we have found a range between which the interest rate lies, we can make another table showing the prices that result from a series of interest rates that go up in increments of 0.1% instead of 1.0%. Below we see the bond prices that result from various interest rates that are between 6.0% and 7.0%:

We see then that the present value of our bond (the price) is equal to $95.92 when we have an interest rate of 6.8%. If at this point we did not find that 6.8% gives us the exact price that we are paying for the bond, we would have to make another table that shows the interest rates in 0.01% increments. You can see why investors prefer to use special programs to narrow down the interest rates - the calculations required to find YTM can be quite numerous!
Calculating Yield for Callable and Puttable Bonds
Bonds with callable or puttable redemption features have additional yield calculations. A callable bond's valuations must account for the issuer's ability to call the bond on the call date and the puttable bond's valuation must include the buyer's ability to sell the bond at the pre-specified put date. The yield for callable bonds is referred to as yield-to-call, and the yield for puttable bonds is referred to as yield-to-put.
Yield to call (YTC) is the interest rate that investors would receive if they held the bond until the call date. The period until the first call is referred to as the call protection period. Yield to call is the rate that would make the bond's present value equal to the full price of the bond. Essentially, its calculation requires two simple modifications to the yield-to-maturity formula:

Note that European callable bonds can have multiple call dates and that a yield to call can be calculated for each.
Yield to put (YTP) is the interest rate that investors would receive if they held the bond until its put date. To calculate yield to put, the same modified equation for yield to call is used except the bond put price replaces the bond call value and the time until put date replaces the time until call date.
For both callable and puttable bonds, astute investors will compute both yield and all yield-to-call/yield-to-put figures for a particular bond, and then use these figures to estimate the expected yield. The lowest yield calculated is known as yield to worst, which is commonly used by conservative investors when calculating their expected yield. Unfortunately, these yield figures do not account for bonds that are not redeemed or are sold prior to the call or put date.
Now you know that the yield you receive from holding a bond will differ from its coupon rate because of fluctuations in bond price and from the reinvestment of coupon payments. In addition, you are now able to differentiate between current yield and yield to maturity. In our next section we will take a closer look at yield to maturity and how the YTMs for bonds are graphed to form the term structure of interest rates, or yield curve.
Sunday, September 5, 2010
Advanced Bond Concepts: Bond Pricing
It is important for prospective bond buyers to know how to determine the price of a bond because it will indicate the yield received should the bond be purchased. In this section, we will run through some bond price calculations for various types of bond instruments.
Bonds can be priced at a premium, discount, or at par. If the bond's price is higher than its par value, it will sell at a premium because its interest rate is higher than current prevailing rates. If the bond's price is lower than its par value, the bond will sell at a discount because its interest rate is lower than current prevailing interest rates. When you calculate the price of a bond, you are calculating the maximum price you would want to pay for the bond, given the bond's coupon rate in comparison to the average rate most investors are currently receiving in the bond market. Required yield or required rate of return is the interest rate that a security needs to offer in order to encourage investors to purchase it. Usually the required yield on a bond is equal to or greater than the current prevailing interest rates.
Fundamentally, however, the price of a bond is the sum of the present values of all expected coupon payments plus the present value of the par value at maturity. Calculating bond price is simple: all we are doing is discounting the known future cash flows. Remember that to calculate present value (PV) - which is based on the assumption that each payment is re-invested at some interest rate once it is received--we have to know the interest rate that would earn us a known future value. For bond pricing, this interest rate is the required yield. (If the concepts of present and future value are new to you or you are unfamiliar with the calculations, refer to Understanding the Time Value of Money.)
Here is the formula for calculating a bond's price, which uses the basic present value (PV) formula:

C = coupon payment
n = number of payments
i = interest rate, or required yield
M = value at maturity, or par value
The succession of coupon payments to be received in the future is referred to as an ordinary annuity, which is a series of fixed payments at set intervals over a fixed period of time. (Coupons on a straight bond are paid at ordinary annuity.) The first payment of an ordinary annuity occurs one interval from the time at which the debt security is acquired. The calculation assumes this time is the present.
You may have guessed that the bond pricing formula shown above may be tedious to calculate, as it requires adding the present value of each future coupon payment. Because these payments are paid at an ordinary annuity, however, we can use the shorter PV-of-ordinary-annuity formula that is mathematically equivalent to the summation of all the PVs of future cash flows. This PV-of-ordinary-annuity formula replaces the need to add all the present values of the future coupon. The following diagram illustrates how present value is calculated for an ordinary annuity:

Each full moneybag on the top right represents the fixed coupon payments (future value) received in periods one, two and three. Notice how the present value decreases for those coupon payments that are further into the future the present value of the second coupon payment is worth less than the first coupon and the third coupon is worth the lowest amount today. The farther into the future a payment is to be received, the less it is worth today - is the fundamental concept for which the PV-of-ordinary-annuity formula accounts. It calculates the sum of the present values of all future cash flows, but unlike the bond-pricing formula we saw earlier, it doesn't require that we add the value of each coupon payment. (For more on calculating the time value of annuities, see Anything but Ordinary: Calculating the Present and Future Value of Annuities and Understanding the Time Value of Money. )
By incorporating the annuity model into the bond pricing formula, which requires us to also include the present value of the par value received at maturity, we arrive at the following formula:

Let's go through a basic example to find the price of a plain vanilla bond.
Example 1: Calculate the price of a bond with a par value of $1,000 to be paid in ten years, a coupon rate of 10%, and a required yield of 12%. In our example we'll assume that coupon payments are made semi-annually to bond holders and that the next coupon payment is expected in six months. Here are the steps we have to take to calculate the price:
1. Determine the Number of Coupon Payments: Because two coupon payments will be made each year for ten years, we will have a total of 20 coupon payments.
2. Determine the Value of Each Coupon Payment: Because the coupon payments are semi-annual, divide the coupon rate in half. The coupon rate is the percentage off the bond's par value. As a result, each semi-annual coupon payment will be $50 ($1,000 X 0.05).
3. Determine the Semi-Annual Yield: Like the coupon rate, the required yield of 12% must be divided by two because the number of periods used in the calculation has doubled. If we left the required yield at 12%, our bond price would be very low and inaccurate. Therefore, the required semi-annual yield is 6% (0.12/2).
4. Plug the Amounts Into the Formula:

From the above calculation, we have determined that the bond is selling at a discount; the bond price is less than its par value because the required yield of the bond is greater than the coupon rate. The bond must sell at a discount to attract investors, who could find higher interest elsewhere in the prevailing rates. In other words, because investors can make a larger return in the market, they need an extra incentive to invest in the bonds.
Accounting for Different Payment Frequencies
In the example above coupons were paid semi-annually, so we divided the interest rate and coupon payments in half to represent the two payments per year. You may be now wondering whether there is a formula that does not require steps two and three outlined above, which are required if the coupon payments occur more than once a year. A simple modification of the above formula will allow you to adjust interest rates and coupon payments to calculate a bond price for any payment frequency:

Notice that the only modification to the original formula is the addition of "F", which represents the frequency of coupon payments, or the number of times a year the coupon is paid. Therefore, for bonds paying annual coupons, F would have a value of one. Should a bond pay quarterly payments, F would equal four, and if the bond paid semi-annual coupons, F would be two.
Pricing Zero-Coupon Bonds
So what happens when there are no coupon payments? For the aptly-named zero-coupon bond, there is no coupon payment until maturity. Because of this, the present value of annuity formula is unnecessary. You simply calculate the present value of the par value at maturity. Here's a simple example:
Example 2(a): Let's look at how to calculate the price of a zero-coupon bond that is maturing in five years, has a par value of $1,000 and a required yield of 6%.
1. Determine the Number of Periods: Unless otherwise indicated, the required yield of most zero-coupon bonds is based on a semi-annual coupon payment. This is because the interest on a zero-coupon bond is equal to the difference between the purchase price and maturity value, but we need a way to compare a zero-coupon bond to a coupon bond, so the 6% required yield must be adjusted to the equivalent of its semi-annual coupon rate. Therefore, the number of periods for zero-coupon bonds will be doubled, so the zero coupon bond maturing in five years would have ten periods (5 x 2).
2. Determine the Yield: The required yield of 6% must also be divided by two because the number of periods used in the calculation has doubled. The yield for this bond is 3% (6% / 2).
3. Plug the amounts into the formula:

You should note that zero-coupon bonds are always priced at a discount: if zero-coupon bonds were sold at par, investors would have no way of making money from them and therefore no incentive to buy them.
Pricing Bonds between Payment Periods
Up to this point we have assumed that we are purchasing bonds whose next coupon payment occurs one payment period away, according to the regular payment-frequency pattern. So far, if we were to price a bond that pays semi-annual coupons and we purchased the bond today, our calculations would assume that we would receive the next coupon payment in exactly six months. Of course, because you won't always be buying a bond on its coupon payment date, it's important you know how to calculate price if, say, a semi-annual bond is paying its next coupon in three months, one month, or 21 days.
Determining Day Count
To price a bond between payment periods, we must use the appropriate day-count convention. Day count is a way of measuring the appropriate interest rate for a specific period of time. There is actual/actual day count, which is used mainly for Treasury securities. This method counts the exact number of days until the next payment. For example, if you purchased a semi-annual Treasury bond on March 1, 2003, and its next coupon payment is in four months (July 1, 2003), the next coupon payment would be in 122 days:
Time Period = Days Counted
March 1-31 = 31 days
April 1-30 = 30 days
May 1-31 = 31 days
June 1-30 = 30 days
July 1 = 0 days
Total Days = 122 days
To determine the day count, we must also know the number of days in the six-month period of the regular payment cycle. In these six months there are exactly 182 days, so the day count of the Treasury bond would be 122/182, which means that out of the 182 days in the six-month period, the bond still has 122 days before the next coupon payment. In other words, 60 days of the payment period (182 - 122) have already passed. If the bondholder sold the bond today, he or she must be compensated for the interest accrued on the bond over these 60 days.
(Note that if it is a leap year, the total number of days in a year is 366 rather than 365.)
For municipal and corporate bonds, you would use the 30/360 day count convention, which is much simpler as there is no need to remember the actual number of days in each year and month. This count convention assumes that a year consists of 360 days and each month consists of 30 days. As an example, assume the above Treasury bond was actually a semi-annual corporate bond. In this case, the next coupon payment would be in 120 days.
Time Period = Days Counted
March 1-30 = 30 days
April 1-30 = 30 days
May 1-30 = 30 days
June 1-30 = 30 days
July 1 = 0 days
Total Days = 120 days
As a result, the day count convention would be 120/180, which means that 66.7% of the coupon period remains. Notice that we end up with almost the same answer as the actual/actual day count convention above: both day-count conventions tell us that 60 days have passed into the payment period.
Determining Interest Accrued
Accrued interest is the fraction of the coupon payment that the bond seller earns for holding the bond for a period of time between bond payments. The bond price's inclusion of any interest accrued since the last payment period determines whether the bond's price is "dirty" or "clean." Dirty bond prices include any accrued interest that has accumulated since the last coupon payment while clean bond prices do not. In newspapers, the bond prices quoted are often clean prices.
However, because many of the bonds traded in the secondary market are often traded in between coupon payment dates, the bond seller must be compensated for the portion of the coupon payment he or she earns for holding the bond since the last payment. The amount of the coupon payment that the buyer should receive is the coupon payment minus accrued interest. The following example will make this concept more clear.
Example 3: On March 1, 2003, Francesca is selling a corporate bond with a face value of $1,000 and a 7% coupon paid semi-annually. The next coupon payment after March 1, 2003, is expected on June 30, 2003. What is the interest accrued on the bond?
1. Determine the Semi-Annual Coupon Payment: Because the coupon payments are semi-annual, divide the coupon rate in half, which gives a rate of 3.5% (7% / 2). Each semi-annual coupon payment will then be $35 ($1,000 X 0.035).
2. Determine the Number of Days Remaining in the Coupon Period: Because it is a corporate bond, we will use the 30/360 day-count convention.
Time Period = Days Counted
March 1-30 = 30 days
April 1-30 = 30 days
May 1-30 = 30 days
June 1-30 = 30 days
Total Days = 120 days
There are 120 days remaining before the next coupon payment, but because the coupons are paid semi-annually (two times a year), the regular payment period if the bond is 180 days, which, according to the 30/360 day count, is equal to six months. The seller, therefore, has accumulated 60 days worth of interest (180-120).
3. Calculate the Accrued Interest: Accrued interest is the fraction of the coupon payment that the original holder (in this case Francesca) has earned. It is calculated by the following formula:

In this example, the interest accrued by Francesca is $11.67. If the buyer only paid her the clean price, she would not receive the $11.67 to which she is entitled for holding the bond for those 60 days of the 180-day coupon period.
Now you know how to calculate the price of a bond, regardless of when its next coupon will be paid. Bond price quotes are typically the clean prices, but buyers of bonds pay the dirty, or full price. As a result, both buyers and sellers should understand the amount for which a bond should be sold or purchased. In addition, the tools you learned in this section will better enable you to learn the relationship between coupon rate, required yield and price as well as the reasons for which bond prices change in the market.
Bonds can be priced at a premium, discount, or at par. If the bond's price is higher than its par value, it will sell at a premium because its interest rate is higher than current prevailing rates. If the bond's price is lower than its par value, the bond will sell at a discount because its interest rate is lower than current prevailing interest rates. When you calculate the price of a bond, you are calculating the maximum price you would want to pay for the bond, given the bond's coupon rate in comparison to the average rate most investors are currently receiving in the bond market. Required yield or required rate of return is the interest rate that a security needs to offer in order to encourage investors to purchase it. Usually the required yield on a bond is equal to or greater than the current prevailing interest rates.
Fundamentally, however, the price of a bond is the sum of the present values of all expected coupon payments plus the present value of the par value at maturity. Calculating bond price is simple: all we are doing is discounting the known future cash flows. Remember that to calculate present value (PV) - which is based on the assumption that each payment is re-invested at some interest rate once it is received--we have to know the interest rate that would earn us a known future value. For bond pricing, this interest rate is the required yield. (If the concepts of present and future value are new to you or you are unfamiliar with the calculations, refer to Understanding the Time Value of Money.)
Here is the formula for calculating a bond's price, which uses the basic present value (PV) formula:

C = coupon payment
n = number of payments
i = interest rate, or required yield
M = value at maturity, or par value
The succession of coupon payments to be received in the future is referred to as an ordinary annuity, which is a series of fixed payments at set intervals over a fixed period of time. (Coupons on a straight bond are paid at ordinary annuity.) The first payment of an ordinary annuity occurs one interval from the time at which the debt security is acquired. The calculation assumes this time is the present.
You may have guessed that the bond pricing formula shown above may be tedious to calculate, as it requires adding the present value of each future coupon payment. Because these payments are paid at an ordinary annuity, however, we can use the shorter PV-of-ordinary-annuity formula that is mathematically equivalent to the summation of all the PVs of future cash flows. This PV-of-ordinary-annuity formula replaces the need to add all the present values of the future coupon. The following diagram illustrates how present value is calculated for an ordinary annuity:

Each full moneybag on the top right represents the fixed coupon payments (future value) received in periods one, two and three. Notice how the present value decreases for those coupon payments that are further into the future the present value of the second coupon payment is worth less than the first coupon and the third coupon is worth the lowest amount today. The farther into the future a payment is to be received, the less it is worth today - is the fundamental concept for which the PV-of-ordinary-annuity formula accounts. It calculates the sum of the present values of all future cash flows, but unlike the bond-pricing formula we saw earlier, it doesn't require that we add the value of each coupon payment. (For more on calculating the time value of annuities, see Anything but Ordinary: Calculating the Present and Future Value of Annuities and Understanding the Time Value of Money. )
By incorporating the annuity model into the bond pricing formula, which requires us to also include the present value of the par value received at maturity, we arrive at the following formula:

Let's go through a basic example to find the price of a plain vanilla bond.
Example 1: Calculate the price of a bond with a par value of $1,000 to be paid in ten years, a coupon rate of 10%, and a required yield of 12%. In our example we'll assume that coupon payments are made semi-annually to bond holders and that the next coupon payment is expected in six months. Here are the steps we have to take to calculate the price:
1. Determine the Number of Coupon Payments: Because two coupon payments will be made each year for ten years, we will have a total of 20 coupon payments.
2. Determine the Value of Each Coupon Payment: Because the coupon payments are semi-annual, divide the coupon rate in half. The coupon rate is the percentage off the bond's par value. As a result, each semi-annual coupon payment will be $50 ($1,000 X 0.05).
3. Determine the Semi-Annual Yield: Like the coupon rate, the required yield of 12% must be divided by two because the number of periods used in the calculation has doubled. If we left the required yield at 12%, our bond price would be very low and inaccurate. Therefore, the required semi-annual yield is 6% (0.12/2).
4. Plug the Amounts Into the Formula:

From the above calculation, we have determined that the bond is selling at a discount; the bond price is less than its par value because the required yield of the bond is greater than the coupon rate. The bond must sell at a discount to attract investors, who could find higher interest elsewhere in the prevailing rates. In other words, because investors can make a larger return in the market, they need an extra incentive to invest in the bonds.
Accounting for Different Payment Frequencies
In the example above coupons were paid semi-annually, so we divided the interest rate and coupon payments in half to represent the two payments per year. You may be now wondering whether there is a formula that does not require steps two and three outlined above, which are required if the coupon payments occur more than once a year. A simple modification of the above formula will allow you to adjust interest rates and coupon payments to calculate a bond price for any payment frequency:

Notice that the only modification to the original formula is the addition of "F", which represents the frequency of coupon payments, or the number of times a year the coupon is paid. Therefore, for bonds paying annual coupons, F would have a value of one. Should a bond pay quarterly payments, F would equal four, and if the bond paid semi-annual coupons, F would be two.
Pricing Zero-Coupon Bonds
So what happens when there are no coupon payments? For the aptly-named zero-coupon bond, there is no coupon payment until maturity. Because of this, the present value of annuity formula is unnecessary. You simply calculate the present value of the par value at maturity. Here's a simple example:
Example 2(a): Let's look at how to calculate the price of a zero-coupon bond that is maturing in five years, has a par value of $1,000 and a required yield of 6%.
1. Determine the Number of Periods: Unless otherwise indicated, the required yield of most zero-coupon bonds is based on a semi-annual coupon payment. This is because the interest on a zero-coupon bond is equal to the difference between the purchase price and maturity value, but we need a way to compare a zero-coupon bond to a coupon bond, so the 6% required yield must be adjusted to the equivalent of its semi-annual coupon rate. Therefore, the number of periods for zero-coupon bonds will be doubled, so the zero coupon bond maturing in five years would have ten periods (5 x 2).
2. Determine the Yield: The required yield of 6% must also be divided by two because the number of periods used in the calculation has doubled. The yield for this bond is 3% (6% / 2).
3. Plug the amounts into the formula:

You should note that zero-coupon bonds are always priced at a discount: if zero-coupon bonds were sold at par, investors would have no way of making money from them and therefore no incentive to buy them.
Pricing Bonds between Payment Periods
Up to this point we have assumed that we are purchasing bonds whose next coupon payment occurs one payment period away, according to the regular payment-frequency pattern. So far, if we were to price a bond that pays semi-annual coupons and we purchased the bond today, our calculations would assume that we would receive the next coupon payment in exactly six months. Of course, because you won't always be buying a bond on its coupon payment date, it's important you know how to calculate price if, say, a semi-annual bond is paying its next coupon in three months, one month, or 21 days.
Determining Day Count
To price a bond between payment periods, we must use the appropriate day-count convention. Day count is a way of measuring the appropriate interest rate for a specific period of time. There is actual/actual day count, which is used mainly for Treasury securities. This method counts the exact number of days until the next payment. For example, if you purchased a semi-annual Treasury bond on March 1, 2003, and its next coupon payment is in four months (July 1, 2003), the next coupon payment would be in 122 days:
Time Period = Days Counted
March 1-31 = 31 days
April 1-30 = 30 days
May 1-31 = 31 days
June 1-30 = 30 days
July 1 = 0 days
Total Days = 122 days
To determine the day count, we must also know the number of days in the six-month period of the regular payment cycle. In these six months there are exactly 182 days, so the day count of the Treasury bond would be 122/182, which means that out of the 182 days in the six-month period, the bond still has 122 days before the next coupon payment. In other words, 60 days of the payment period (182 - 122) have already passed. If the bondholder sold the bond today, he or she must be compensated for the interest accrued on the bond over these 60 days.
(Note that if it is a leap year, the total number of days in a year is 366 rather than 365.)
For municipal and corporate bonds, you would use the 30/360 day count convention, which is much simpler as there is no need to remember the actual number of days in each year and month. This count convention assumes that a year consists of 360 days and each month consists of 30 days. As an example, assume the above Treasury bond was actually a semi-annual corporate bond. In this case, the next coupon payment would be in 120 days.
Time Period = Days Counted
March 1-30 = 30 days
April 1-30 = 30 days
May 1-30 = 30 days
June 1-30 = 30 days
July 1 = 0 days
Total Days = 120 days
As a result, the day count convention would be 120/180, which means that 66.7% of the coupon period remains. Notice that we end up with almost the same answer as the actual/actual day count convention above: both day-count conventions tell us that 60 days have passed into the payment period.
Determining Interest Accrued
Accrued interest is the fraction of the coupon payment that the bond seller earns for holding the bond for a period of time between bond payments. The bond price's inclusion of any interest accrued since the last payment period determines whether the bond's price is "dirty" or "clean." Dirty bond prices include any accrued interest that has accumulated since the last coupon payment while clean bond prices do not. In newspapers, the bond prices quoted are often clean prices.
However, because many of the bonds traded in the secondary market are often traded in between coupon payment dates, the bond seller must be compensated for the portion of the coupon payment he or she earns for holding the bond since the last payment. The amount of the coupon payment that the buyer should receive is the coupon payment minus accrued interest. The following example will make this concept more clear.
Example 3: On March 1, 2003, Francesca is selling a corporate bond with a face value of $1,000 and a 7% coupon paid semi-annually. The next coupon payment after March 1, 2003, is expected on June 30, 2003. What is the interest accrued on the bond?
1. Determine the Semi-Annual Coupon Payment: Because the coupon payments are semi-annual, divide the coupon rate in half, which gives a rate of 3.5% (7% / 2). Each semi-annual coupon payment will then be $35 ($1,000 X 0.035).
2. Determine the Number of Days Remaining in the Coupon Period: Because it is a corporate bond, we will use the 30/360 day-count convention.
Time Period = Days Counted
March 1-30 = 30 days
April 1-30 = 30 days
May 1-30 = 30 days
June 1-30 = 30 days
Total Days = 120 days
There are 120 days remaining before the next coupon payment, but because the coupons are paid semi-annually (two times a year), the regular payment period if the bond is 180 days, which, according to the 30/360 day count, is equal to six months. The seller, therefore, has accumulated 60 days worth of interest (180-120).
3. Calculate the Accrued Interest: Accrued interest is the fraction of the coupon payment that the original holder (in this case Francesca) has earned. It is calculated by the following formula:

In this example, the interest accrued by Francesca is $11.67. If the buyer only paid her the clean price, she would not receive the $11.67 to which she is entitled for holding the bond for those 60 days of the 180-day coupon period.
Now you know how to calculate the price of a bond, regardless of when its next coupon will be paid. Bond price quotes are typically the clean prices, but buyers of bonds pay the dirty, or full price. As a result, both buyers and sellers should understand the amount for which a bond should be sold or purchased. In addition, the tools you learned in this section will better enable you to learn the relationship between coupon rate, required yield and price as well as the reasons for which bond prices change in the market.
Subscribe to:
Posts (Atom)